North America Trade, Exports and Imports
Please note that we are not authorised to provide any investment advice. The content on this page is for information purposes only.
The North American trade, exports and imports were adversely affected by the global economic slowdown and low oil and commodity prices in 2008-2009, especially after the trade boom during 2002-2007. The merchandise trade deficit in the US reached a record $840 billion in 2009 before shrinking to $450 billion in 2009. The Canadian trade scenario has always enjoyed good relations with its US counterpart, following the US-Canada Free Trade Agreement and the North Atlantic Free Trade Agreement (NAFTA) membership.
The North American trade, exports and imports were adversely affected by the global economic slowdown and low oil and commodity prices in 2008-2009, especially after the trade boom during 2002-2007. The merchandise trade deficit in the US reached a record $840 billion in 2009 before shrinking to $450 billion in 2009. The Canadian trade scenario has always enjoyed good relations with its US counterpart, following the US-Canada Free Trade Agreement and the North Atlantic Free Trade Agreement (NAFTA) membership. Canada enjoys a substantial trade surplus with the US, which absorbs nearly 80% of Canadian exports each year. For the US, Canada is also its largest foreign supplier of energy and electricity.[br]
North America Trade: USA Exports and Imports
The value of products imported into the US in 2009 fell by 25.9% to $1.56 trillion compared to $2.1 trillion in 2008. Total exports from the US in 2009 dipped by 17.9% to $1.06 trillion from $1.29 trillion in 2008. However, the trade deficit in 2009 was $315.3 billion, a sharp decrease from $500.1 billion in 2008. The following table shows America’s top import sales in 2009 and the gain/loss percentage in 2009 compared to 2008.
|
Commodity
|
Import Worth
|
Gain/Loss Percentage
|
|
Crude Oil |
$188.5 billion |
-44.9% |
|
Pharmaceutical preparations |
$81.4 billion |
3.1% |
|
Passenger cars |
$80.9 billion |
-35.6% |
|
Household goods |
$60.3 billion |
-2.1% |
|
Computer accessories |
$53.2 billion |
-11.7% |
|
Automotive parts |
$47.3 billion |
-27.2% |
|
Computers |
$40.8 billion |
+0.2% |
|
Telecommunications equipment |
$37.3 billion |
-16.8% |
|
Video equipment |
$36.1 billion |
-119.9% |
The next table shows America’s top export sales in 2009 and the gain/loss percentage in 2009 compared to 2008.
|
Commodity
|
Export Worth
|
Gain/Loss Percentage |
|
Civilian aircraft |
$74.7 billion |
1% |
|
Semiconductors |
$37.5 billion |
-26% |
|
Industrial machinery |
$30.9 billion |
-19.1% |
|
Automotive parts and accessories |
$30.4 billion |
-24.6% |
|
Passenger cars |
$27.5 billion |
-44.5% |
|
Medicinal equipment |
$26.9 billion |
-0.5% |
|
Electric apparatus |
$26.1 billion |
-15.5% |
|
Plastic materials |
$25.5 billion |
-19.3% |
|
Telecom equipment |
$28.7 billion |
-12.6% |
North America Trade: Canada Exports and Imports[br]
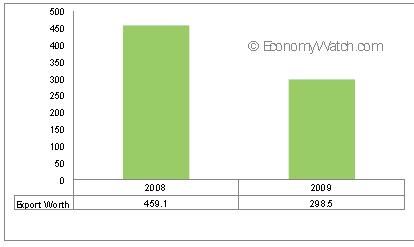
Canada’s primary export commodities include motor vehicles and parts, industrial machinery, aircraft, telecommunications equipment; chemicals, plastics, fertilizers; wood pulp, timber, crude petroleum, natural gas, electricity, and aluminum. The following chart shows Canada’s exports in US billion dollars in 2008 and 2009.