Namibia Economy
Please note that we are not authorised to provide any investment advice. The content on this page is for information purposes only.
Namibia is a lower middle-income country comes under Sub Saharan African region, according to the classification made by the World Bank on the basis of income and region for the year 2006. The country has a total surface area of 824.3 thousand square kilometers as in 204 with a forest area of 80,330 square kilometers in 2000.
Namibia is a lower middle-income country comes under Sub Saharan African region, according to the classification made by the World Bank on the basis of income and region for the year 2006. The country has a total surface area of 824.3 thousand square kilometers as in 204 with a forest area of 80,330 square kilometers in 2000.
Namibia Economy Social Indicators
The country has total population of 2.0 millions as of the year 2004 with an annual growth rate of 1.2 percent in the same year.

The following table shows the demographic and social indicators of the country over the years.
| Social Indicators | 2000 | 2003 | 2004 |
| Population, total | 1.9 million | 2.0 million | 2.0 million |
| Population growth (annual %) | 2.2 | 1.3 | 1.2 |
| Life expectancy at birth, total (years) | 52.3 | 48.0 | 47.5 |
| Fertility rate, total (births per woman) | 4.3 | 3.9 | 3.8 |
| Mortality rate, infant (per 1,000 live births) | 50.0 | .. | 46.8 |
| Mortality rate, under-5 (per 1,000) | 69.0 | .. | 63.4 |
Economic Indicators Of Namibia Economy
Mining and mineral products exports have made the country’s economy stronger in the recent years. Important economic indicators of the country over the years are as follows:
| Econmic Indicator | 2000 | 2003 | 2004 |
| GNI, Atlas method (current US$) | 3.5 billion | 3.9 billion | 4.8 billion |
| GNI per capita, Atlas method (current US$) | 1,870.0 | 1,990.0 | 2,380.0 |
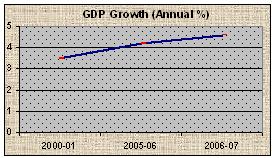
| GDP (current US$) | 3.4 billion | 4.5 billion | 5.7 billion |
| GDP growth (annual %) | 3.5 | 3.5 | 6.0 |
| Inflation, GDP deflator (annual %) | 10.7 | -0.6 | 2.9 |


