Dominican Republic – Fast Facts
Please note that we are not authorised to provide any investment advice. The content on this page is for information purposes only.
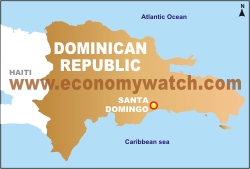
Dominica is an Upper Middle Income economies comes under Latin America and Caribbean region as to the classification made by the world bank on the basis of income and region for the year 2006.
Dominica economy largely depends upon Agriculture, industry and services. All the sectors of the country’s economy are equally important. As to the statistics, services constitute a larger share of the total GDP followed by industries.
Major agricultural products of the country are banana, mangoes, cocoa and fishery products. Important industries are coconut oil, tourism, and furniture.