Durable Goods Prices are Falling

Please note that we are not authorised to provide any investment advice. The content on this page is for information purposes only.
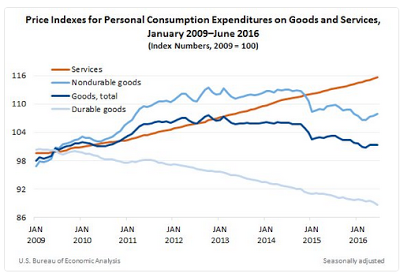
This Great Graphic is deceptively simple. It is chart from the Bureau of Economic Analysis based on the price indices from components of personal consumption expenditure.
The rust line is service prices. They are steadily increasing. No deflation or disinflation here. Think about rent, medical services, education, and entertainment.
The three blue lines are different measures of goods prices. The dark blue line is total goods prices. They have been leveling off. The reason lies with the top blue line, which is non-durable goods prices.
The bottom blue line is durable goods prices. Deflationary forces have not been arrested. This is an important development. It may help explain some (but not all) of the weakness in investment. Capital equipment is a subset of durable goods, the price of which has fallen around 10% over the past seven years.
Observers easily recognize how investment can be labor saving. Replace the teller with an ATM. The toll collector can be replaced by some sort of electronic billing (e.g. EZ Pass). However, investment is often capital saving as well. A business buys a machine tool for $100k. It is depreciated (read tax break) over ten years. Now it is time to replace the machine tool. The new tool may be both cheaper in price and more efficient in capability.
Replacement capital carries with it technological advances and at a reduced cost. Net new investment, which is investment minus depreciation may be in a secular declining trend as Harold Vatter warned 35 years ago and well before Hansen’s “secular stagnation” theory was revived by Summers.
The decline in goods prices relative to service prices may also impact how the different sectors are measured. Although the chart is of US prices, other countries prices are broadly similar. Disinflation if not deflation is evident in goods prices, while service price are rising. This price development in China may be exaggerating the shift taking place between the two sectors.
Great Graphic: The Decline in Durable Goods Prices is republished with permission from Marc to Market


