Case Shiller Index, CSI, US House Price Index
Please note that we are not authorised to provide any investment advice. The content on this page is for information purposes only.
A methodology for tracking US home prices
The Case Shiller Index (CSI) is widely used by mortgage lenders, securities issuers, insurers and rating agencies to keep track of the US residential real estate trends and to manage home price risk. The latest Case Shiller Index shows that home prices in the ten largest US cities plunged 14.1% in May 2008, as compared to May 2007. None of the cities saw price gains, signaling that the US housing crisis may be worsening. Many economists fear that the trend is unlikely to reverse before 2010.
Developed by economists Karl Case, Robert Shiller and Allan Weiss during the 1980s, the Case Shiller Index (CSI) is widely used to measure the nominal value of the US residential real estate market and aids in the study of the causes and consequences of home price changes on the country’s economy.
Before the development of the CSI, economists were using indices based on median home prices in a particular geographic area. However, the usage of median home prices of an area can provide misleading indications of price changes as a result of shifts in the sampling of homes that comprise the median measures from one month to another. The CSI was therefore created with the aim of resolving these problems by using the repeat sales pricing technique.
The CSI index uses data on single-family home re-sales and re-sold sale prices to form sale pairs and is published with a time lag of two months on the last Tuesday of every month. The indices are designed to measure the changes in the prices of homes that have not undergone any signficant positive or negative changes.
A popular model of the Case Shiller Index is the 20 MSA view used by Standard and Poors in the S&P/Case Shiller US National Home Price Index, which is a composite of single-family home price indices calculated every quarter for the nine US Census divisions. The CSI is also calculated for 20 regional indices and two composite indices, which are essentially the average across regions. These indices aim to measure the growth in the value of residential real estate in various US regions.
The CSI indices are compiled by Fiserv Inc, which bought the index in May 2002. Fiserv analyzes and quality-controls residential property data collected from several sources, and uses proprietary software to offer indices covering thousands of zip codes and metro areas. The Case Shiller indices are maintained by an Index Committee, whose members include Standard & Poor’s, Fiserv and leading industry experts.
These indices are considered to be the most accurate and trustworthy home price change measures for market and loan portfolio surveillance, customer retention, loss reserve reviews, mortgage default, loss and prepayment analyses.
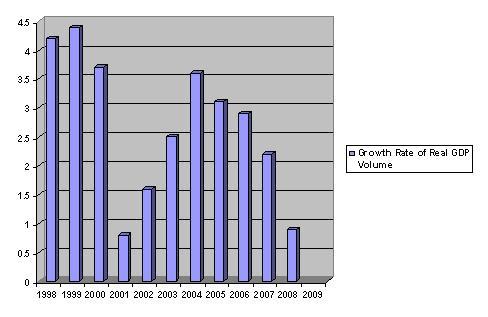
The trend of the real GDP growth rate of the US economy is shown in the following graph.