Bulgaria Economic Structure
Please note that we are not authorised to provide any investment advice. The content on this page is for information purposes only.
Until late-1989, Bulgaria was run according to the Soviet ideals of market. Bulgaria’s economic structure relied on centralized planning rather than the market forces, and all crucial decisions were taken by the administrators.[br]
Until late-1989, Bulgaria was run according to the Soviet ideals of market. Bulgaria’s economic structure relied on centralized planning rather than the market forces, and all crucial decisions were taken by the administrators.[br]
Sticking to this policy helped Bulgaria undergo extensive industrialization at a fast pace and attract bigger investments as well. However, the light industry and agriculture suffered. It forced collectivization of agriculture and nationalization.
Bulgaria Economic Structure
In terms of contributing to the economy and absorbing the workforce, the service sector of the Bulgarian economy contributes the maximum to the national GDP, accounting for 64.9% of the GDP according to the 2009 estimates. Industries came in second with 27.6%, while agriculture contributed 7.5% to the GDP.
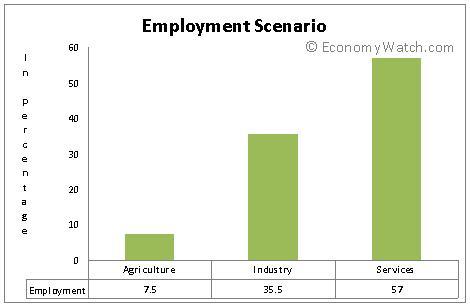
In terms of employment generation, the service sector contributes the maximum, with over 57% of the workforce. The graph shows how the different sectors contribute to the employment scenario (in percentage):
However, Bulgaria still grapples with the employment scene and almost 9.1% of the population is unemployed, according to the 2009 estimates. This, in contrast with the 2006 estimates of 6.3%, seems to be a worrisome area. Almost 14.1% of the total population lives below the poverty line.[br]
Revenues and expenditures are almost similar at $17.3 billion and $17.89 billion, respectively. Public debt was reported at 21.4% in 2009. Inflation was controlled effectively at 2.7% in 2009, against the rather high 12.3% in 2008. Various instruments, such as increased prime lending rated, helped. According to the 2009 estimates, the prime lending rate was 10.86%, in comparison to 10% in 2008.
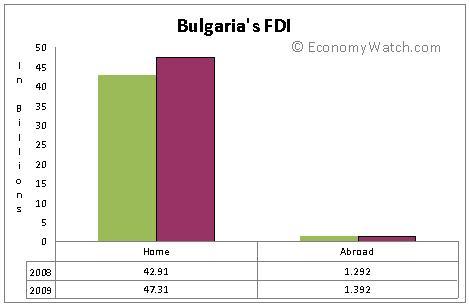
External debt decreased to $49.28 billion in 2009, in comparison to the 2008 figure of $51.46 billion. The FDI, both external and internal, increased in 2009. The graph below shows the performance (in billions):
With industries trying to pick up from the dismal performance in the past years, FDIs are expected to grow even further.


