GBP/USD Price Forecast: Descending Triangle to Drive Sell Under $1.3290

Please note that we are not authorised to provide any investment advice. The content on this page is for information purposes only.
- Russian aggression in Ukraine failed to subside despite the two rounds of peace talks, which raised concerns in the market.
- DXY soared for the fifth consecutive session on Friday and reached its highest level since May 2020 at 98.92.
- GBP/USD is trading at the 1.3225 level, having violated the descending triangle pattern
The GBP/USD price forecast remains bearish under $1.3190 level. The direct currency pair closed at $1.3227 after setting a high of $1.3356 and a low of $1.3201. The currency pair extended its loss and dropped to its lowest level since December 21st, 2021. The falling prices could be attributed to a risk-averse market sentiment fueled by escalating geopolitical tensions.
Refer to our trading guides to enhance your forex trading skills.
Geopolitical Tensions Between Russia Ukraine in Play
Russian aggression in Ukraine failed to subside despite the two rounds of peace talks, which raised concerns in the market. Reports suggest that Russia attacked the Zaporizhzhya Nuclear Power Plant, Europe’s largest nuclear power station, in Ukraine. It increased demand for safe-haven assets and weighed heavily on riskier assets such as the British Pound. Despite the Ukrainian government’s efforts to allay fears about radiation risks, concerns about Russia’s aggression grew and continued to weigh on riskier assets.
Stronger Dollar Weighs on GBP/USD
Apart from this, another major factor involved in the losses on GBP/USD was the strength of the US dollar. The DXY soared for the fifth consecutive session on Friday and reached its highest level since May 2020 at 98.92. The US dollar was gaining bets due to the intensifying conflict in Ukraine. Hence, it prompted demand for the world’s reserve currency. The US dollar is considered the world’s reserve currency during safe-haven events as it is the most liquid form of asset.
The rising sanctions from the West, including the freezing of assets and cutting off certain Russian entities from the SWIFT network, combined with the reports of the Russian attack on the nuclear power plant, added further to the risk-off market tone and supported the US dollar, which ultimately added further loss in GBP/USD.
GBP/USD Fundamentals Analysis
On the data front, on Friday, at 14:30 GMT, the Construction PMI surged to 59.1 versus the forecasted 57.4 and supported the British Pound, which capitulated further loss in GBP/USD. At 18:30 GMT, the average hourly earnings in the United States fell to 0.0%, versus the expected 0.5%, weighing on the dollar. The non-farm employment change increased to 678K against the forecasted 407K and supported the US dollar. The unemployment rate declined to 3.8% against a predicted 3.9% and supported the US dollar. Most of the data from the US side was favorable, which strengthened the greenback and added further to the decline in the price of GBP/USD.
Furthermore, the US dollar was also high as Fed Chair Jerome Powell maintained a hawkish tone during his semi-annual monetary policy report. He favored pushing interest rates by 25 bps next week, which gave further strength to the greenback.
What’s Next?
Next week, the UK economic docket has nothing much to offer except Wednesday’s annual budget release. At the same time, the US docket will release the February inflation report on Thursday along with the UoM Consumer Sentiment reading on Friday. However, the inflation report could significantly impact the US dollar. On the other hand, the Russia and Ukraine war-related reports and developments will continue to impact the prices of all markets next week. It is because a cease-fire looks highly unlikely to be seen as two peace talks have already failed to ease the situation.
GBP/USD Price Forecast – Daily Technical Levels
Support Resistance
1.3300 1.3404
1.3256 1.3464
1.3197 1.3508
Pivot Point: 1.3360
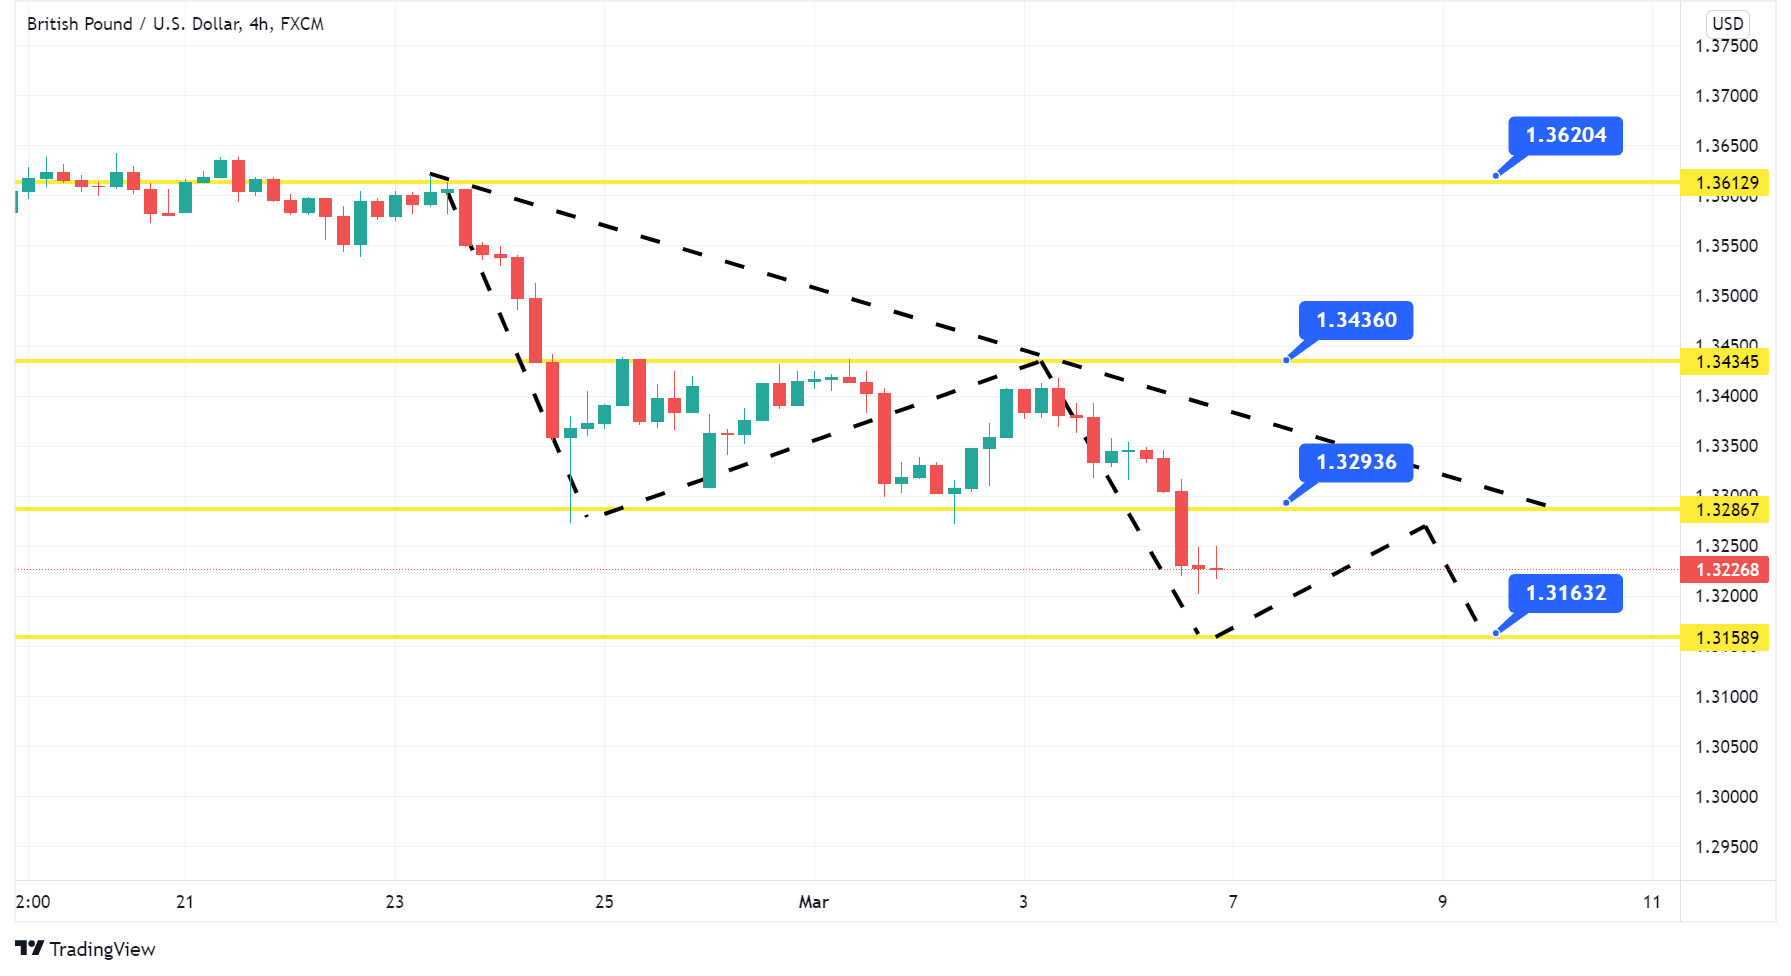
GBP/USD 4-Hour Timeframe
GBP/USD Price Forecast – Technical Outlook
The GBP/USD is trading at the 1.3225 level, having violated the descending triangle pattern on the 4-hour timeframe. The triangle pattern was providing support at the 1.3287 level. The closing of candles below the 1.3287 level confirms a bearish breakout.
Typically, a breakout of a descending triangle pattern drives a downtrend in the market. Therefore, the GBP/USD may head lower towards the next support level of 1.3160. A surge in selling bias could create further room for selling until the 1.3050 support zone.
On the other hand, the triple bottom breakout level of 1.3285 will act as a resistance for GBP/USD. A spike in demand could push the GBP/USD price towards the 1.3350 and 1.3445 levels. The 50-day EMA (exponential moving average) and the RSI are supporting the selling trend. Therefore, the idea is to look for a sell trade upon a bullish correction until the 1.3285 level.
Good luck, and stay tuned for more updates!