Robin Hood is not Working in the U.K.

Please note that we are not authorised to provide any investment advice. The content on this page is for information purposes only.
The aim of progressive taxation and the welfare state is to redistribute wealth from the richest to the poorest in an effort to erode the worst aspects of poverty and inequality. How well the British tax and benefits system is doing towards this aim can be seen in the latest, newly released inequality statistics from the Office of National Statistics.
The aim of progressive taxation and the welfare state is to redistribute wealth from the richest to the poorest in an effort to erode the worst aspects of poverty and inequality. How well the British tax and benefits system is doing towards this aim can be seen in the latest, newly released inequality statistics from the Office of National Statistics.
What the ONS figures show is how deeply seated inequality has become in Britain. The national share of all income is heavily skewed towards fewer and fewer people. In 2014-15, the richest fifth of British earners received 45.5% of all UK income, and the richest tenth received 29%. The top 1% received around an eighth (12.7%) of gross income, and the top 0.1% – around 65,000 people – almost a twentieth (5%). Of course, given the recent revelations about offshore tax affairs revealed in the Panama Papers, it’s likely that this admitted income is considerably understated.
Wealth is even more highly concentrated than income. Between July 2012 and June 2014, the most wealthy 20% of households accounted for 62% of all private household wealth, whereas the top 20% of earners received 40% of the total disposable income (as adjusted for the size and composition of the household). As with income, much of the wealth of the richest few is likely to be hidden from view.
The roots of inequality
Inequality grew sharply during the 1980s under the Conservative governments of Margaret Thatcher as the drive to greater equality during the post-war years was replaced with a new ideological approach that believed that allowing markets to be freer and the rich to get richer would produce a more dynamic economy. In 1979 the top 1% of earners amassed around 5% of all income – this had risen to just over 15% by 2010, dropping slightly since from the aftermath of the 2007-8 financial crisis – though now back on its way up.
Income inequality is reduced by the impact of direct taxation and the benefits system, but their redistributive effects haven’t swayed the overall trend. The disposable income of the richest has grown much faster than for everyone else: the rich get richer and inequality widens.
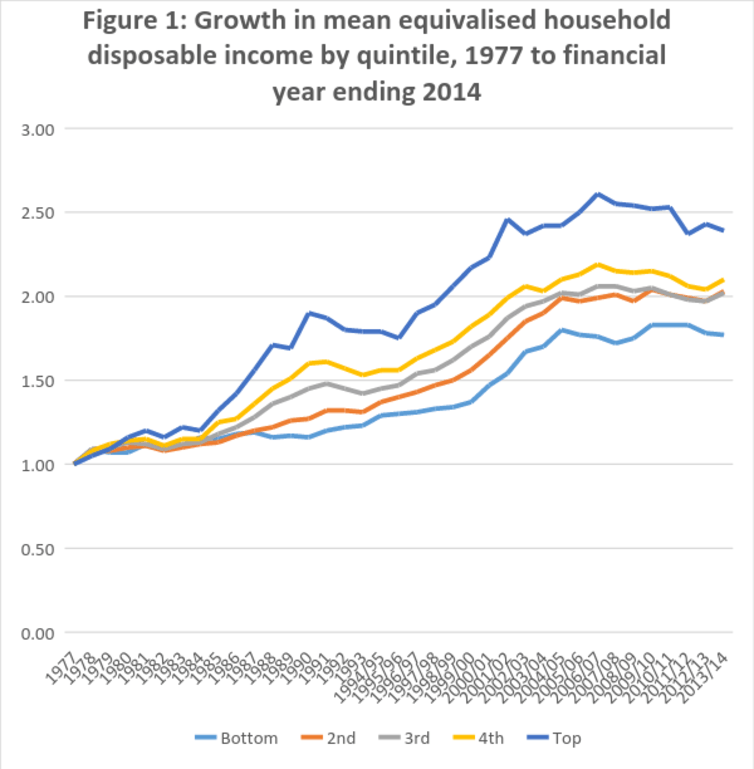
Household net disposable income 1977-2014, with population divided into fifths by income. ONS, Author provided
Figure 1 shows the average (mean) disposable income for the richest fifth of households in 2013-14 was around 2.4 times higher than in 1977, after accounting for inflation and household composition. By contrast, the average income of the poorest fifth had grown by only around 1.8 times over the same period. The financial crash of 2007-8 halted income growth across the board, but when everyone takes a step down those at the bottom are hit harder than those at the top.
Does redistribution work?
The redistributive effect of tax is much less than that of cash benefits, which have the greatest impact on reducing inequality by far. The importance of working tax credits and housing benefit in mitigating poverty has increased as wages have been held down and housing costs risen. They also serve to conceal the impact of austerity measures on those with the lowest incomes, and these latest figure have only just begun to reflect the effects of benefits cuts.
Many have argued that these changes will lead to a serious and substantial cut to the living standards of the poor. Even Iain Duncan Smith, who as work and pensions secretary had overseen numerous reductions throughout the benefits system, questioned in his resignation letter whether the cuts had gone too far.
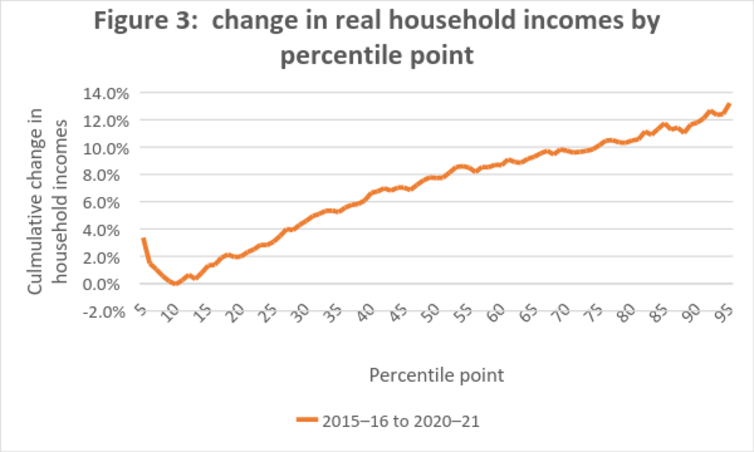
Changes to income after tax and benefits. Institute for Fiscal Studies, Author provided
ONS figures provide only a record of the past, so other sources are required to see the impact of changes such as to the national minimum wage and the ending of tax credits. Figure 3 shows the projected change in household income to each percentile point of the income scale, as calculated by the Institute for Fiscal Studies based on earnings projections from the Office for Budget Responsibility. What it shows is that those on higher incomes receive greater increases in their projected household incomes.
The direct effect of the current government’s tax and benefit policy has been to take money from workers earning at the bottom of the income distribution who also receive benefits, in particular through removing working tax credits, and this has countered any projected increase in wages, for example from the higher national living wage. Those at the very bottom are likely to fare fractionally better, having little income to remove.

Projected impact of tax and benefit reforms to 2019. ONS, Author provided
Figure 4 shows the projected impact of these changes, as shown divided into tenths by income earnings and type of household. It shows that cuts to benefits have the most impact on working households with children.
Households with children already have much higher rates of poverty than those without or pensioner households. Research from the Poverty and Social Exclusion in the UK project, the largest ever research undertaking of its, has shown how levels of deprivation – where people are unable to afford life’s necessities – have risen substantially over the last 30 years, even despite the average increase of living standards. The tax and benefits now in the pipeline that are still to play out will inevitably push more and more families and their children further into poverty.
Hard Evidence: does income tax and benefits reduce inequality in Britain? is republished with permission from The Conversation


