Litecoin Price Slips by 3.70% – Time to Buy LTC Coin?

Please note that we are not authorised to provide any investment advice. The content on this page is for information purposes only.
- LTC/USD has bounced off the $153 support level, and the closing of the “Three White Soldiers” pattern is signaling an uptrend in LTC.
- LTC has risen 2% from its lows of $153 to trade at $156 at press time, which is amazing.
- Litecoin price prediction remains bullish above the $153 trading level.
This week, there was no significant upward movement in Bitcoin, Ethereum, Ripple, or Litecoin against the US dollar. Previously, LTC struggled to break through the $165 resistance zone and began a new fall. There was a break below the $160 and $155 support levels. Currently, the LTC/USD has bounced off the $153 support level, and the closing of the “Three White Soldiers” pattern is signaling an uptrend in LTC. However, Bitcoin’s positive momentum saw Litecoin soar in recent hours.
Litecoin (LTC/USD) medium-term forecast
On the charts, LTC has risen 2% from its lows of $153 to trade at $156 at press time, which is amazing. Litecoin bulls have a long way to go before demands for $200+ can become a reality. In December, the price action saw numerous testing of the $140 level in search of buyers. This level served as support in September and major resistance in June, indicating a significant level. Similarly, since August, the $163 area (lower red box) has been tested several times as both a demand and a supply area.
At the time of writing, the LTC bulls and bears were fighting to possess this territory. Trading volume, however, has been slightly lower than in past months’ checks of this area. For instance, the 23.6 percent retracement level at $176 was located above the $163 region. This figure was calculated using LTC’s drop from $413 in May to $103 in July.
With growing interest in blockchain and crypto as a whole, this might be a good opportunity to buy Litecoin and rise with the market.
Before LTC is regarded as having bullish strength on longer time horizons, it must rise above $163 and $176, and buying volume must be seen. The price action told a story of solid buyers near $143 support, supported by the OBV, which created a rounded bottom and could rise higher in the next few days. A further rise in OBV (higher lows) must be accompanied by upward price movement to give the move legitimacy.
The RSI shifted from neutral 50 to support, but the 60 climbed over. This figure was previously examined when the price hit $190 (upper red box) in search of liquidity. As a result, if the price rises to $190 while the RSI rises over 60 in the following weeks, it could imply that bulls have indeed regained power on longer timeframes.
The weaker dollar continues to support LTC/USD
The dollar was on track for its worst week in four months, as riskier assets ranging from bitcoin to the Australian currency clung onto recent gains, supported by fading concerns over the severity of the new COVID-19 variation. The dollar index, which measures the greenback against six major counterparts, was at 95.96, down 0.1 percent on the day and track for a 0.7 percent slide from last Friday’s closing – its worst week since late August.
Except for the yen, another safe-haven currency, the dollar has lost ground against most other currencies. On Friday, the Japanese yen was trading at 114.37 per dollar and 82.82 versus the Australian dollar, nearly the same level as when news of the Omicron variant originally broke in late November.
Litecoin short-term forecast – LTC/USD gained support at $153
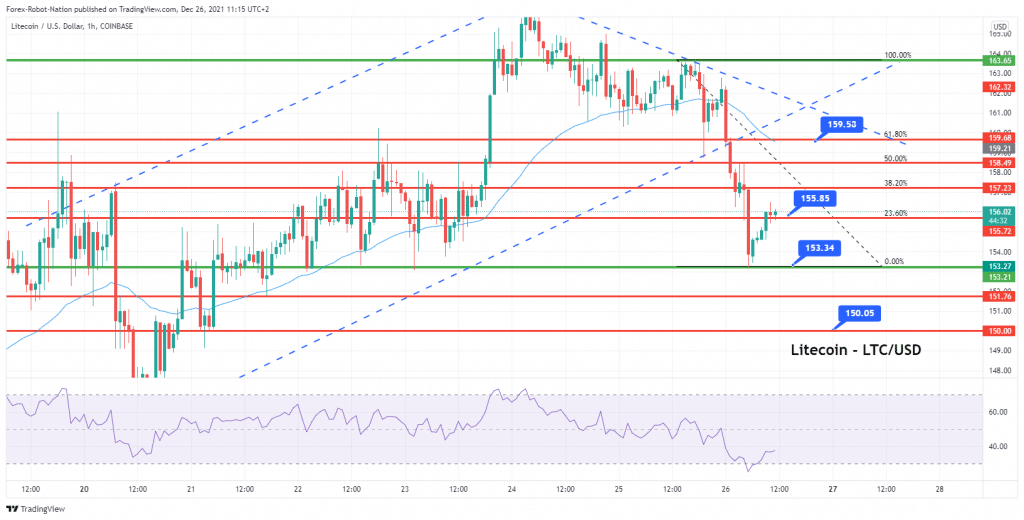
Litecoin price prediction remains bullish above the $153 trading level. The LTC/USD coin has closed a series of bullish candles, supporting an uptrend. The LTC/USD has completed 23.6% Fibonacci retracement at 155.76 level on the hourly timeframe.
A surge in Litecoin demand can slice through 155.76 resistance level and lead the LTC/USD price towards 38.2% Fibonacci retracement. The major resistance stays at 157.30 and 159.78 levels, marking 61.8% Fibonacci retracement level.
Conversely, the closing of candles under 38.2% Fibo level of 157 level can trigger a selling bias. The LTC/USD support prevails at 153 level on the lower side. A surge in selling trend can trigger a breakout below 153 level until 150 or 147 level. Let’s consider staying bullish above $153 and vice versa. All the best.
Buy Crypto at eToro from just $10 Now!
![]()