Markets
Will Australia Chair a G20 Summit with a Meaningful Outcome?
The genesis of the G20 is a tale of two crises. The first — the Asian financial crisis — led to the creation of the G20 as a meeting of finance ministers and central bank governors from 19 of the...

A Preview of this Week’s Events Among the Emerging Markets
EM assets are starting the week on the front foot under the favorable constellation of a weaker dollar, stronger stocks and the unexpected result of the presidential elections in Brazil. In addition, after nearly a month of losses (MSCI EM...
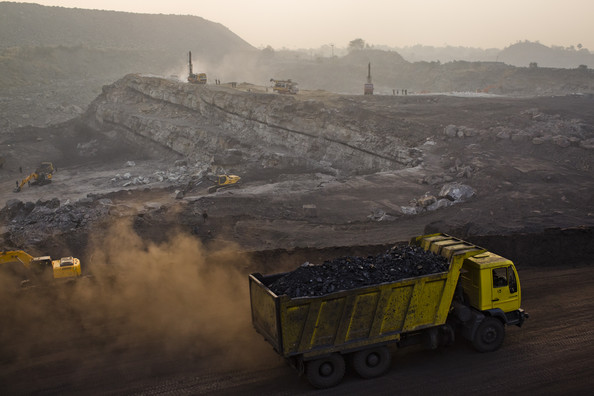
India’s path to a low-carbon economy includes raising the coal tax
India’s 2014–15 budget doubled the rate of tax on coal from 50 rupees (US$0.82) to 100 rupees (US$1.64) per metric tonne. Though the additional revenue could accelerate the deployment of renewable energy technologies in India, the increase in coal tax...
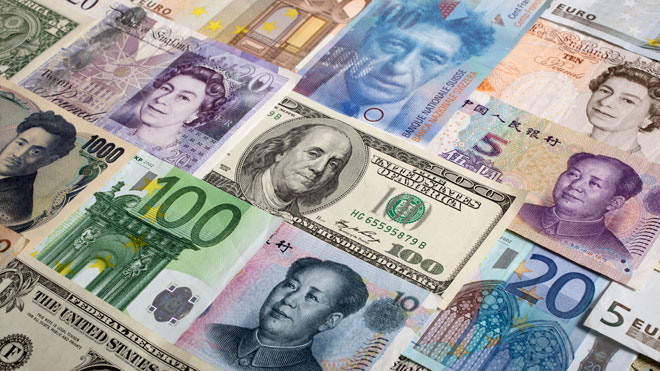
Global Currency Movement and other Economic News
The main theme in Asia and Europe has been a somewhat heavier dollar tone, against the major and emerging market currencies. There has not been much of a fundamental driver as perhaps a bit of caution in a stretched-market ahead...

Looking ahead at this week’s events and the global investment climate
The broad economic conditions have been shaped to a large extent by the different policy responses to the Great Financial Crisis. For reasons that need not concern us here, the US and UK policy response was relatively stronger than the...

Changes Abound Throughout Emerging Markets
1) USD/HKD traded at its highest level since May 2012.2) Russian officials confirm that capital controls are not on the cards.3) The Turkish central bank started to push bank against currency weakness – albeit slightly.4) Dilma’s chances of re-elections increased...
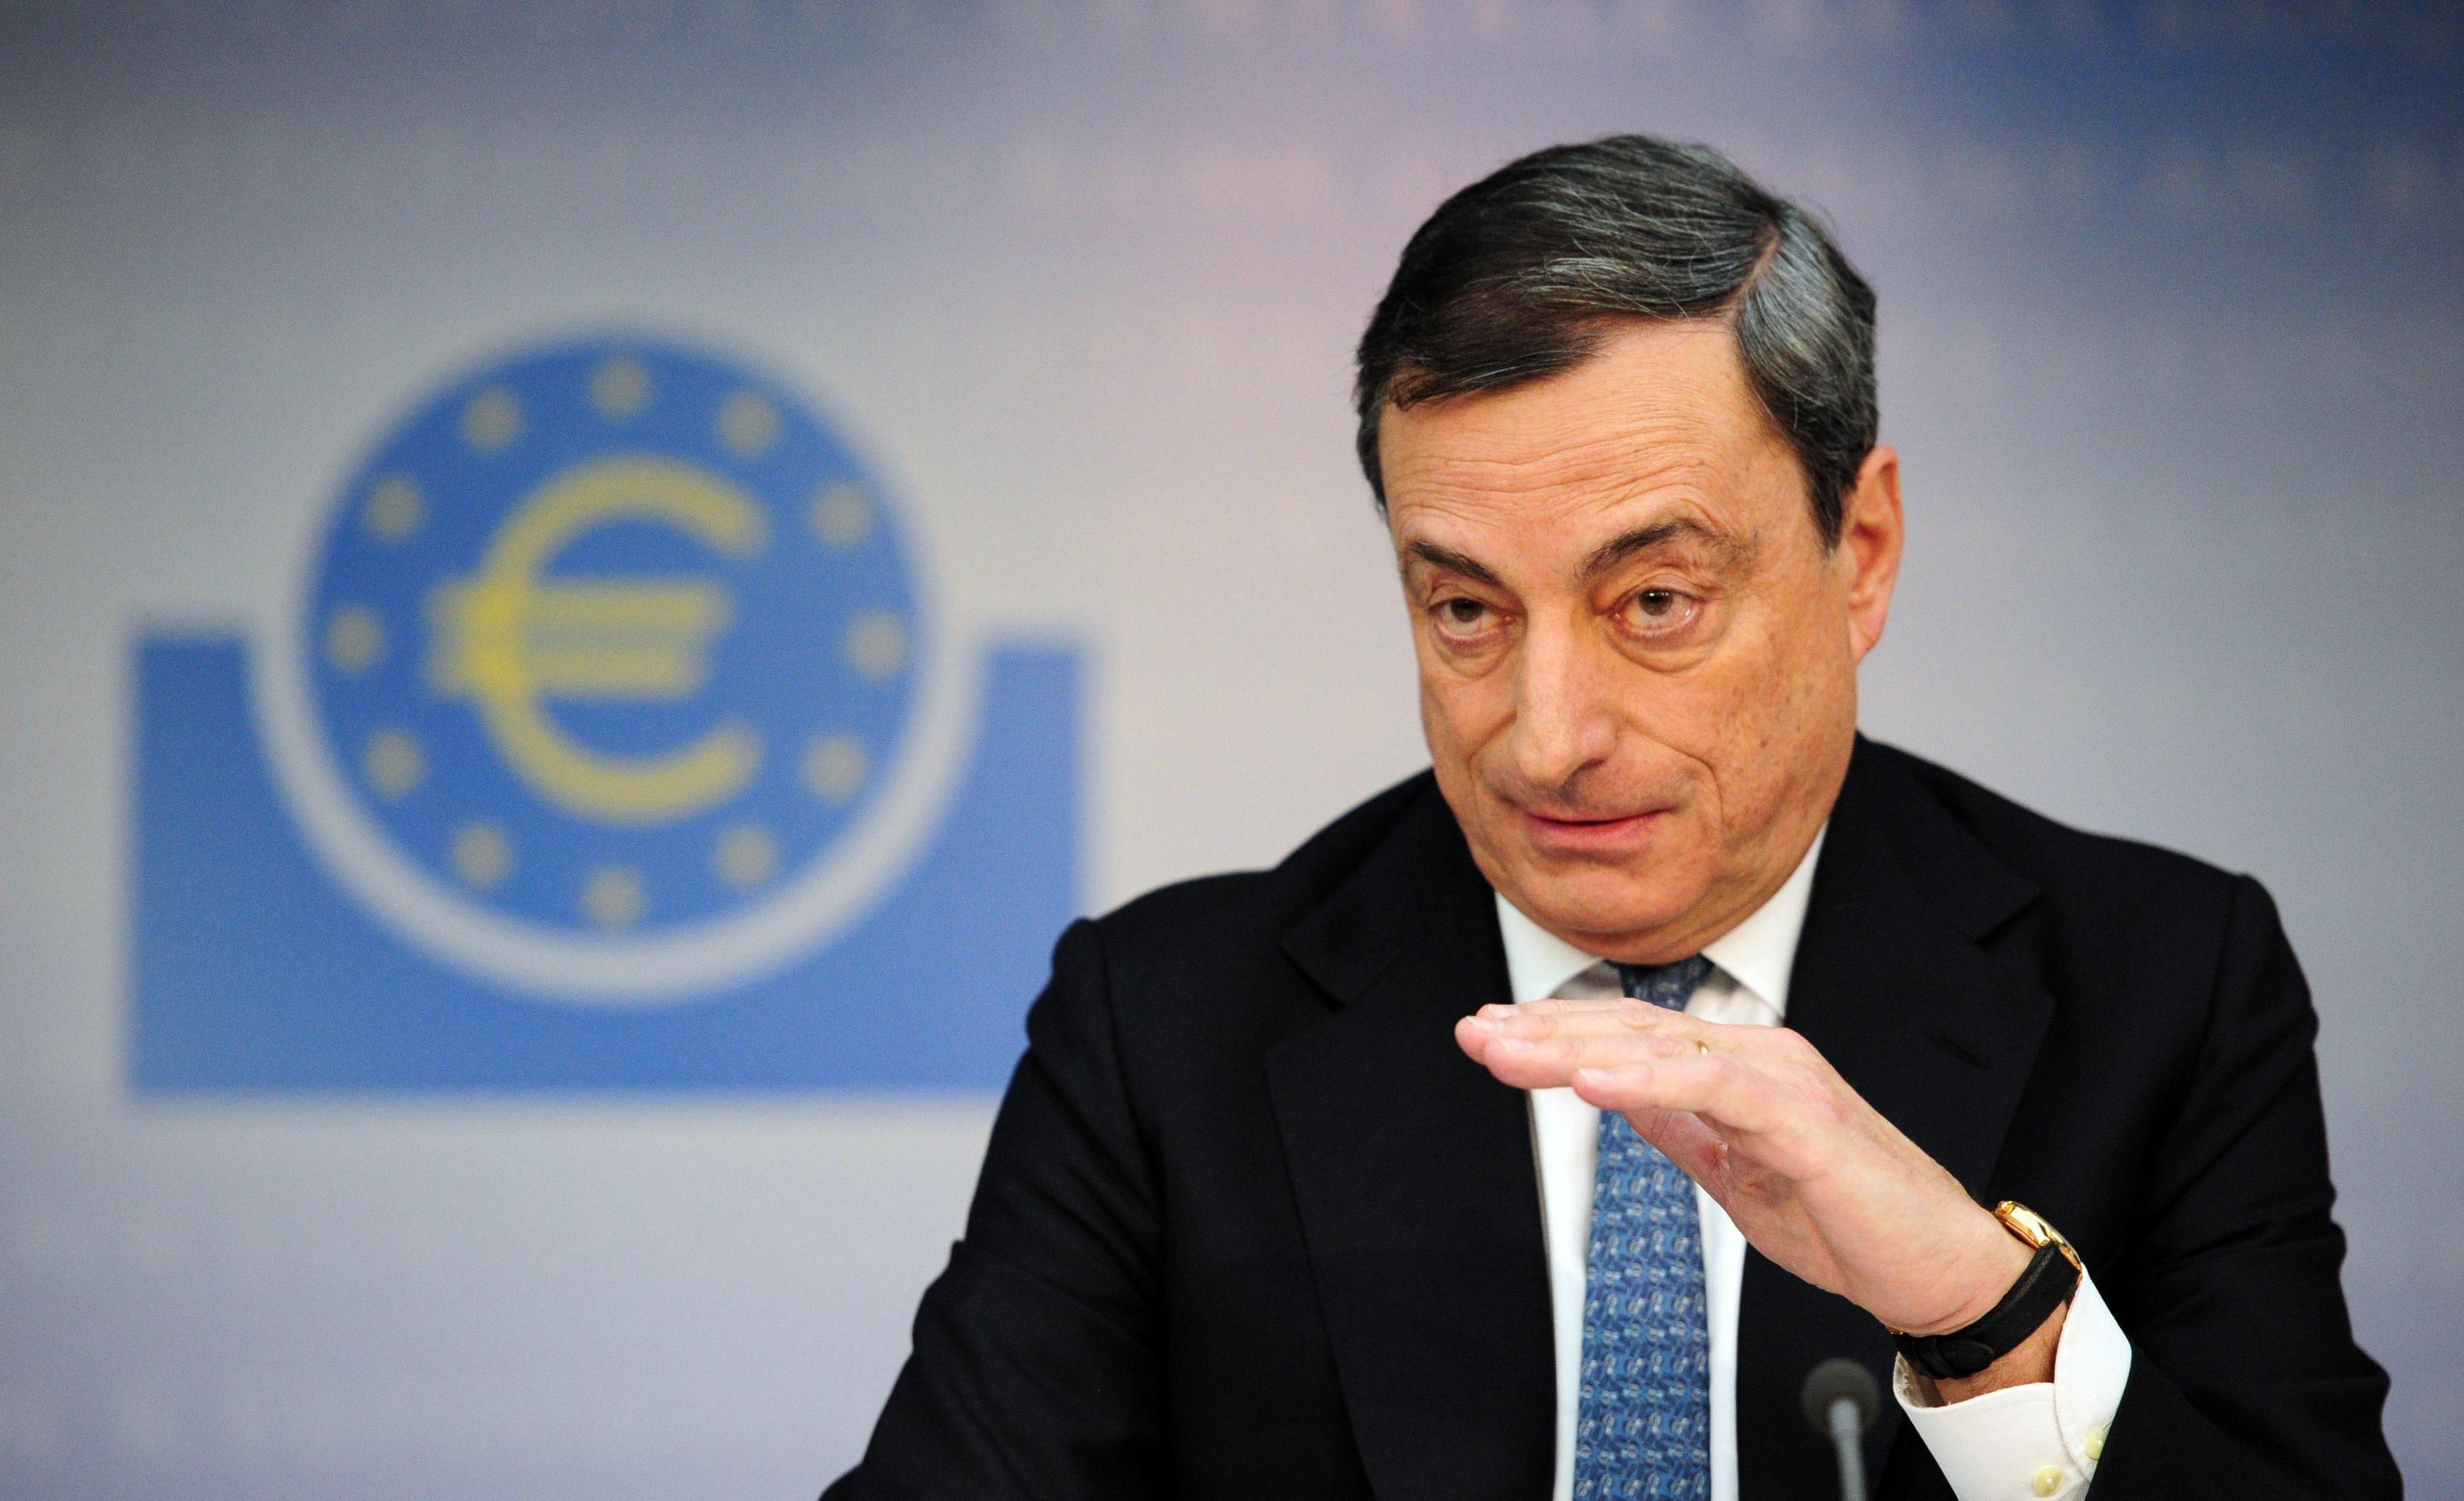
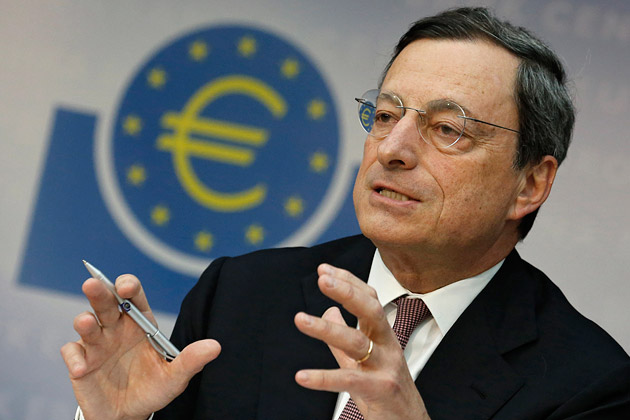
Draghi’s Comments End Up Rather Anti-Climactic
This seems to be the first time in several months that ECB President Draghi has been rather anti-climactic. The disappointment or the "sell the rumor buy the fact" scenario we suggested is, in fact, unfolding, and the euro is...
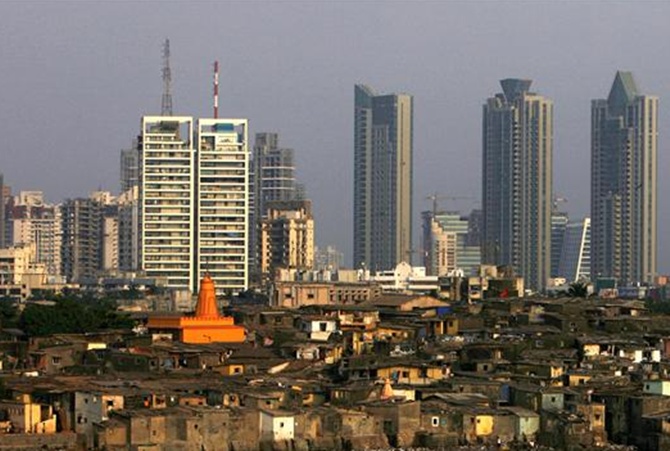
‘Smart Cities’ in India also need to be Livable
With more than half of the global population now living in urban areas, some in abject poverty, the path to sustainable development must pass through cities. In a meeting in July, the Working Group for the UN’s Sustainable Development Goals...
The ECB Meeting and More Economic Events with Global Ramifications
The ECB meeting and details about the asset purchase plan is the key event of the day. However, there is something else happening. A string of disappointing US data and the sell-off in equities have sparked a bond market...

The ECB and its Options for Promoting Eurozone Growth
The European Central Bank meets tomorrow. The focus is on the details of the asset-backed securities and covered bond plan that was announced last month. There are three key issues related to this new initiative: What instruments will be purchased,...
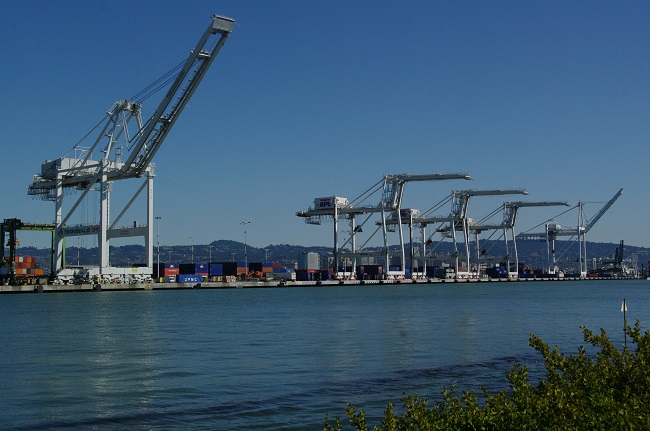
U.S. Dollar Strength and its Impact on International Trade
With the ECB meeting and US jobs data the key events of the week, it is understandable the August US trade balance, due out Friday, is not drawing much attention. However, the combination of the growth differentials, favoring the...
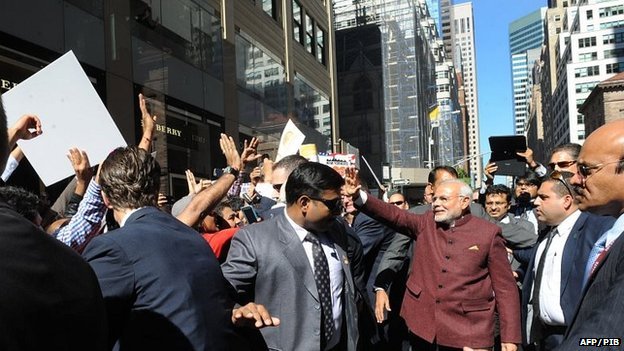
The American Dream From Modi’s View
Before his election to India’s prime ministership, Narendra Modi was persona non grata in the United States because of his alleged complicity in the ethnic violence in Gujarat of 2002 in which 790 Muslims and 254 Hindus died, 2500 people...
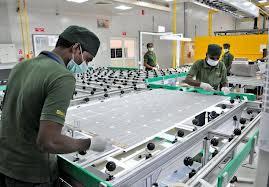
Can India’s Manufacturing Sector Grow Under the Current Government?
Increasing the GDP growth rate will be a major task for India’s new government. GDP growth will be critical for eradicating poverty and improving the living standards of India’s population. The economy also faces the daunting challenge of providing employment...

Markets Digest PMI Readings from China and the Eurozone
The US dollar remains in a consolidative mode as participants await fresh incentives. The bulls have been denied fresh excuses to push the trend that has carried the US Dollar Index higher for an unprecedented ten consecutive weeks. The US...
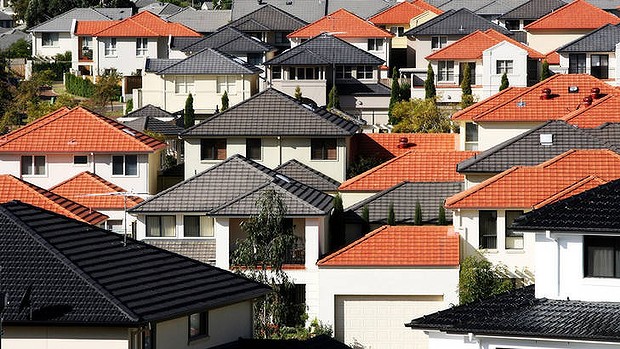
Is Australia’s housing bubble about to pop?
If Australia’s property bubble bursts, the consequences would be disastrous for an economy dominated by oversized banks. But Government policies aimed at propping up the market are simply making the bubble bigger. And bigger. If Australia’s property bubble bursts, the...


