Iceland Bounces Back
Please note that we are not authorised to provide any investment advice. The content on this page is for information purposes only.
Disgruntled Icelanders recently forced their prime minister to quit, and are threatening to hand power to self-styled pirates at an early election. However, whereas other European voters are culling traditional parties out of weakness, Reykjavik’s are rebelling out of strength.
Disgruntled Icelanders recently forced their prime minister to quit, and are threatening to hand power to self-styled pirates at an early election. However, whereas other European voters are culling traditional parties out of weakness, Reykjavik’s are rebelling out of strength. In contrast to Eurozone countries (core as well as periphery) that remain deeply constrained by excessive external debt, Iceland has just paid down its foreign obligations by a cool US$61 billion, returning them to the safe 2006 level.
The country that suffered proportionally the world’s biggest financial collapse in 2008 is now set to boom again as it diversifies from fish, tourism and aluminium into renewable energy and information technology. Its GDP, already among the highest in the world per capita, is back above the pre-crisis level and set to rise (on central bank forecasts) by 4% in 2016 and 2017 – twice the Eurozone and UK rates.
Although its overgrown banks were one of the causes of the global financial crisis, Iceland responded to their meltdown in the opposite way from the rest of Europe – and against the received wisdom of most economists.
It allowed its currency to fall in value – an option unavailable to Eurozone members, which had to ratchet down wages and prices through “internal devaluation”. It nationalised the big banks that had run up unsustainable debt, rescuing only the fraction that served the domestic economy. It imposed capital controls so that the banks’ creditors and other foreign investors couldn’t withdraw their money. Locals, including pension funds, couldn’t invest abroad.

Protesters in Reykjavik in 2010. EPA/S Olafs
Let’s get fiscal
The central bank also tightened monetary policy. Its policy rate peaked at 18% in 2009, and was still at 5.75% this month. In the UK, Eurozone and the US, central banks pushed their rates to near-zero and applied quantitative easing. Defying the austerity that prevailed across Europe, Iceland then allowed fiscal policy to take the economic and social strain. In particular, public money was used to relieve households of the debt that would otherwise stop any spending recovery.
Economist Paul Krugman, perhaps shielded from the orthodoxy by a Nobel prize, has repeatedly drawn attention to the way these policies allowed rule-breaking Iceland to recover far earlier than less afflicted Eurozone peers – even Ireland, the poster child for conventional “adjustment policies”.
Until now, critics had one powerful riposte to this improbable ray of Nordic sunshine. They said it was a false dawn. They argued that the whole recovery was only achieved on the back of draconian capital controls, in place since November 2008. Removing them would be painful, but failing to lift them promptly would have equally dire consequences.
Foreign investors would despair of getting their trapped cash back – making it impossible for Icelanders to borrow again even for worthwhile investment far away from banking. The critics said that domestic investors’ savings would, with nowhere else to go, turn the already strong tourism and stock market investment booms into overheated bubbles whose bursting unleashes more trouble.
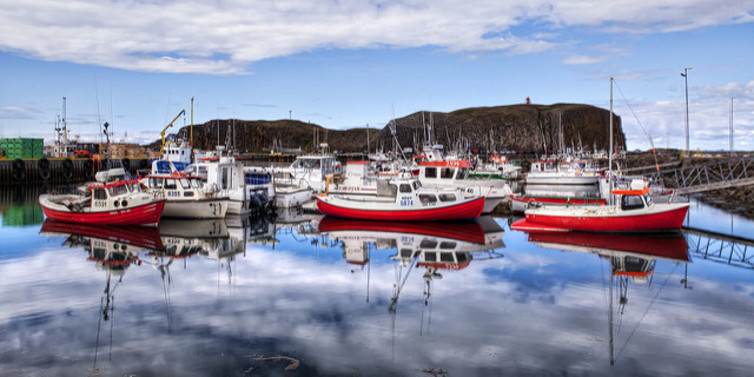
In the red. Fishing boats ready for launch. Johnny Peacock/Flickr, CC BY-NC-ND
Emerging from capital controls is notoriously tricky, especially when they’ve been in place for eight years and when it’s a small, open economy with a narrow productive base of mainly cod-fishers and whale-watchers. Therefore, the pessimists have tended to hint that when the controls lift, the whole fairy-tale escape story will unravel.
In this nightmare exit scenario, Iceland’s currency (the kronur) will plunge as foreign funds flee, never to return. Interest rates will rise even higher to rescue the exchange rate, choking-off investment, without stopping the runaway inflation sparked by imports getting more expensive. The weaker kronur will leave the country struggling to service its remaining foreign debt, despite its recent reduction.
Kronur capitalism
In practice, Iceland has regained economic strength inside its gilded cage – to the extent that it can now step outside, melt it down and resell the gold. The current account surpluses permitted by the devaluation, and the nationalised bank assets that regained value after the economy’s return to growth, have enabled the repayment of so much foreign debt that the rest will be manageable, even if the currency sinks when controls go. It’s a stark contrast to the Eurozone and especially Greece, which had to ask its creditors for debt relief that will not begin until 2018.
The chances of a kronur crash have diminished because the current account is back in surplus (foreign transactions bring in more money than they take out), and because foreign investors are again being attracted to Iceland. They like its high interest rates, growth prospects and investment opportunities. Icelandic households and businesses can live with higher borrowing costs because they’ve paid down their debts, while incomes have been rising fast.
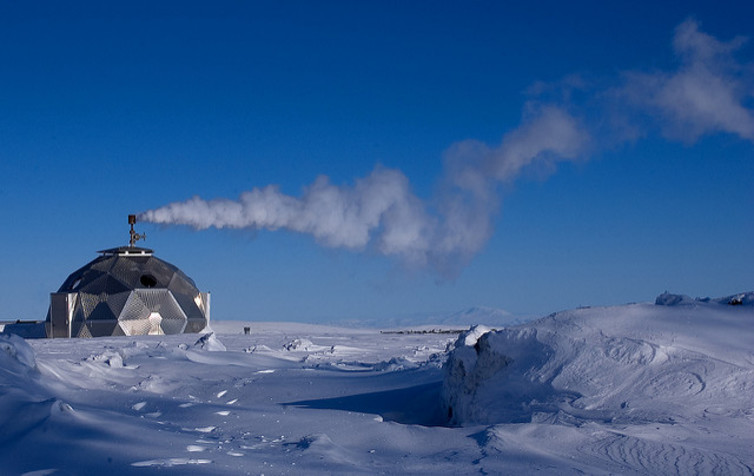
Icelandic geothermal borehole. Lydur Skulason/Flickr, CC BY
Although a remote island with a population of 300,000 and unique natural resources could be dismissed as a special case, Iceland’s remarkable renaissance makes its remedies a serious challenge to the orthodoxy. Krugman is not the only one to find useful lessons in this Nordic saga.
The IMF, which used to insist on free capital movement as precondition for assistance and recovery, has published research, which assigns capital controls a valuable role in maintaining stability in a world of volatile international money flows.
Privateers, not privatisers
The sting in this unlikely tale turns out to be political, not financial. The recovery was laid out by the Social Democrats and Green Party in Iceland in a 2009-13 coalition, and taken towards completion by a coalition of the Independence Party and Progressives. However, Icelandic voters appear to have rounded on all the political groups that used to serve as government and opposition.
The Pirates – launched in Iceland in 2012 as a campaign for more democracy and freedom of information – have led recent opinion polls with a commanding 40%, and are well placed to lead any government formed after early elections this autumn.
Neo-liberal orthodoxy could still return – in the form of David Oddsson, who (as finance minister, prime minister and central bank governor) was an architect of the financial liberalisation that preceded the 2008 crash, and who has joined an unusually crowded field. However, if normal politics is restored, it’s only because highly abnormal economics made good the elites’ past mistakes.
Diamond geysers: rule-breaking Iceland completes its miracle economic escape is republished with permission from The Conversation


