China 1: Uber 0
Please note that we are not authorised to provide any investment advice. The content on this page is for information purposes only.
Uber has announced its exit from the Chinese taxi market by merging with arch-rival Didi Chuxing in a US$35 billion deal. Uber is selling its operations to Didi, with Uber China investors receiving a 20% stake in Didi, according to reports.
Uber has announced its exit from the Chinese taxi market by merging with arch-rival Didi Chuxing in a US$35 billion deal. Uber is selling its operations to Didi, with Uber China investors receiving a 20% stake in Didi, according to reports.
It represents a major defeat for the San Francisco-based tech giant after a long and hard-fought battle to dominate China’s ride hailing market. Uber tried to succeed where other Western companies had failed in China but, like Google and Amazon before it, found that Chinese markets tend to be enormously competitive with very narrow margins. On top of this, Uber found itself the victim of the business model that is behind its own success in numerous other countries – the network effect.
Uber’s business model relies on being the first entrant to a market, then rapidly developing its size and scale so that the competitors that follow are disadvantaged to the point of a forced exit. Uber’s success in other countries has followed this formula. By being first to a market, Uber generates rapid scale through subsidies, offering both cheap rides to passengers and providing incentives to attract drivers.
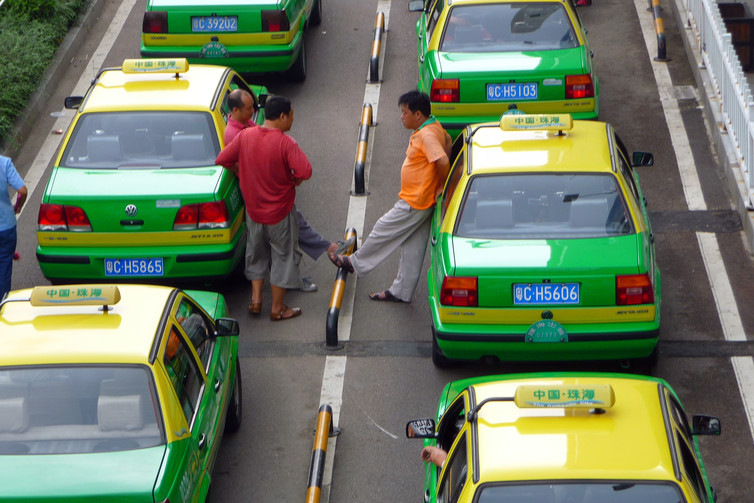
Crowded market. dcmaster/flickr, CC BY-NC
As passenger numbers increase, this attracts more drivers who receive more fares. Greater numbers of drivers provides higher customer responsiveness, which is the key customer need, followed by lower cost fares. The model usually leads to a winner take all situation, as later entrants have to attract passengers without the drivers to provide a competitive service level.
Second best
The network effect model paid dividends for Uber in the US and many European cities. However, in China, Didi Chuxing got there first. The product of a merger between the country’s homegrown ride-hailing leaders, Didi Dache and Kuaidi Dache, Didi Chuxing is believed to hold 80% of the market through its own aggressive use of subsidies.
The side that is late to the party might as well give up. The costs of unseating the leader in terms of attracting passengers and drivers becomes enormous, as Uber has experienced in China. Its attempts to get in on the Chinese market through discounts and promotions have left the company with losses of roughly US$2 billion.
The drive to dominate the Chinese market came directly from Uber CEO Travis Kalanick. He was heavily involved in Uber’s launch into China – first visiting the country on a scouting trip in April 2013. In addition, his aggressive investments elsewhere have generally paid off. With profits from its operations in 75 other countries subsidising China, Kalanick was no doubt hoping that its investment in China would eventually pay off. Ultimately, a face saving exit was needed, which Didi Chuxing has provided.
The promise and pitfalls of China
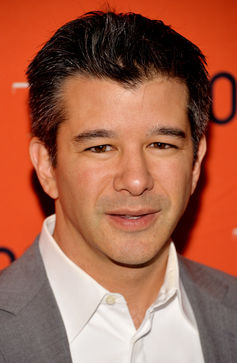 Travis Kalanick. EPA/Justin Lane (Right)
The Chinese market has been the graveyard for many Western businesses. Despite showing sensitivity to the unique nature of the China market (for example, by setting up a separate entity, Uber China, to partner with local investors), Uber joins this group.
Alongside the offer of hundreds of millions of consumers, markets in China are very competitive. Not only is technology and knowhow difficult to protect, competitors are often government owned and do not have to make a return. Didi Chuxing has significant investment from China’s internet giants Tencent and Alibaba, as well as the country’s sovereign wealth fund CIC, and Apple.
When businesses internationalise they usually need a partner who understands the culture, connections, distribution and the market itself. The objective is usually to buy out the local partner once a developed understanding has been achieved by the multinational. However, in China, because the market is difficult, the reverse often occurs, with multinationals often selling out to local partners.
For example, brewing giant SABMiller’s Snow brand of beer, reputed to hold 20% of the Chinese beer market, was sold to China Resource Enterprise, its government owned partner, for a tiny US$1.5 billion earlier this year. Others have similarly exited such as Tesco and Groupon. Western businesses often bring their knowledge, experience, technology and capabilities – and leave them there. In Uber’s case, this is in return for a 20% shareholding in Didi Chuxing. If Yahoo’s experience with Alibaba is anything to go by, this could be the best way of profitably participating in this difficult market.
Overall, Uber’s exit demonstrates the difficulty for late entrants in web-based “network” markets, which have to wait for changes in technology or market trends before they can prosper. It also shows the difficulty of Chinese markets which can deliver enormous volumes but are highly competitive. Local competitors often hold the advantages. Here, Uber joins a long line of companies the world over, whose boards are pondering their losses in China’s markets and considering their options.
How Uber crashed in China is republished with permission from The Conversation


