Asian Capital Flow Determinants

Please note that we are not authorised to provide any investment advice. The content on this page is for information purposes only.
Earlier literature examined determinants of international capital flows especially during the period of high and persistent capital inflows to emerging economies during 2009–2013.1 The literature mainly identified the push and pull factors and explained how these factors affect the capital flows into emerging Asia “on average.” In other words, the literature calculated the effects of these factors “on the mean” of the distribution of capital flows.
Earlier literature examined determinants of international capital flows especially during the period of high and persistent capital inflows to emerging economies during 2009–2013.1 The literature mainly identified the push and pull factors and explained how these factors affect the capital flows into emerging Asia “on average.” In other words, the literature calculated the effects of these factors “on the mean” of the distribution of capital flows.
Figure 1 shows the distribution of capital flow between May 2013 and September 2015 based on data from the EPFR Global Database. This is the period after the taper tantrum on 21 May 2013 and, as a result, capital flows became vulnerable to sudden changes in the market’s mood.
The mean of the distribution is −US$8.17 million and the figure illustrates various percentiles of the distribution. It is clear from the figure that, during this period of high uncertainty, the net bond flows are volatile showing both high positive (inflow) and negative (outflow) values.
These extreme values are considerably different from the mean. Therefore, to anticipate the change in bond flows, one should study the effects of push/pull factors not only on the mean but also on other parts of the bond flow distribution, especially at high inflows and outflows. In order to study this, we use quantile (or percentile) regression to calculate the said effects on various percentiles of the distribution and compare the results to those of the usual mean regression.
Figure 1: Distribution of Net Bond Flow into Asian Economies,
May 2013–September 2015 ($ million)
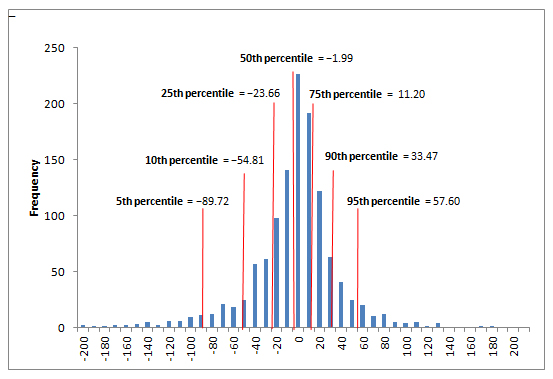
Note: The economies included are the People’s Republic of China; Hong Kong, China; India; Indonesia; the Republic of Korea; Malaysia; the Philippines; Singapore; and Thailand. Data smaller than the first percentile and bigger than the 99th percentile are excluded.
Source: Authors’ calculation.
An analysis of the recent push and pull factors of the bond flows
In our study, the push factors consist of global factors, such as a tighter global liquidity condition (proxied by the Libor–OIS spread in percentage points) and higher global risk aversion (proxied by the percentage change in the volatility index VIX). The pull factors consist of local factors that are specific to Asia, such as the local currency returns vis-à-vis the US dollar, the yield spreads between 10-year local bonds and the 10-year United States Treasury bonds, and the country risk premiums (proxied by percentage change in the credit default swaps).
The data are on a weekly frequency. These push and pull factors are in the one-period lag term. Our findings are shown in the column charts in Figure 2 where each column represents an estimated impact at different points on the distribution. We separate the impacts on the mean and on the percentiles by using different background colors.
Figure 2: Estimated Impacts on the Distribution ($ million)
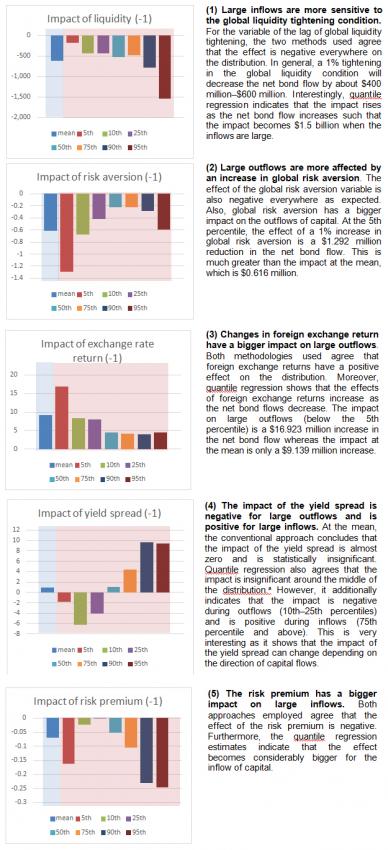
a The estimated coefficients of the quantile regressions are not statistically significant at the 5th and 50th percentiles.
Source: Authors’ calculations.
Key takeaway
Our study shows that more information can be obtained by analyzing the effects of push/pull factors not only on the mean but also on other parts of the bond flow distribution. Both methods agree on the sign of almost all variables (except the yield spread), but quantile regression gives more detailed results.
It shows that the effects of global liquidity conditions and local risk premiums on large inflows may be more than three times as much than on the average flow. Similarly, the impacts of global risk aversion and foreign exchange returns on large outflows can be twice as much than on mean-level flows.
For the yield spread, both methods agree that its impact is negligible when the net flow is of an average size. However, quantile estimates also show that the said impact can be negative with large outflows and positive with large inflows. The positive relationship between yield spread and capital inflows is to be expected. Moreover, it is interesting to see from our study that raising the yield spread may not stop the outflow of capital.
Thus, we think that using quantile regression to complement the mean regression can provide a better understanding of the determinants of capital flows when the capital flows are volatile. Moreover, analysts may want to consider these insights when forecasting the movement of capital flows.
The effect of push/pull factors on the distribution of capital flows into Asia is republished with permission from Asia Pathways


