GBP/USD Price Forecast: Why 1.3150 Could Drive Uptrend in Sterling?

Please note that we are not authorised to provide any investment advice. The content on this page is for information purposes only.
- Bank of England’s hawkish stance on the need for additional rate hikes was a significant headwind for the British pound.
- GBP/USD pair gained traction following the release of poor UK retail sales figures in February, which fell 0.3 percent.
- Closing candles above 1.3150 can drive a bullish bias in GBP/USD up to 1.3220, and vice versa.
During the early European trading session, the GBP/USD price forecast failed to extend its early-day modest upward rally. The GBP/USD retreated to the 1.3200 round-figure mark due to weaker UK macro data. The cross-currency pair gained positive traction in early Friday trading, aided by US dollar weakness. The uptick, however, lacked bullish conviction and ran out of steam near the 1.3225 regions.
Refer to our trading guides to enhance your forex trading skills.
BoE Stance of Monetary Policy
The Bank of England’s hawkish stance on the need for additional rate hikes was a significant headwind for the British pound. The gains, however, were short-lived due to the release of poor UK retail sales figures in February. It showed a 0.3 percent drop.
The generally positive risk tone continued to weaken the safe-haven US dollar. Moreover, it’s extending some support to the GBP/USD pair, at least for a time. The Fed’s more hawkish stance, on the other hand, should limit the dollar’s losses.
GBP/USD Fundamental Outlook
The GBP/USD currency pair is trading at 1.3183 and consolidating in the range between 1.3172 and 1.3225. The early gains in the GBP/USD pair could be attributed to the USD’s decline. However, a cautious mood has prevailed over Ukraine-Russia tensions, which has posed a challenge to the pair’s buyers, especially in recent mixed UK data.
The US Dollar Index (DXY) falls 0.38 percent intraday to 98.41 at the latest, as the market fails to extend weekly gains despite sluggish yields. However, as of press time, US 10-year Treasury yields were hovering around 2.36 percent, while S&P 500 futures failed to follow Wall Street’s gains and did not reflect the risk-off atmosphere by rounding to 4,510-15.
The intraday decline in the GBP/USD pair gained traction following the release of poor UK retail sales figures in February, which fell 0.3 percent. This was significantly lower than market expectations of 0.6 percent growth and represented a significant slowdown from the 1.9 percent increase reported in January. Furthermore, non-fuel sales fell by 0.7 percent in the reported month, compared to 1.7 percent growth in January and a 0.5 percent increase expected.
Positive Risk-tone Underpins GBP/USD
A generally positive risk tone, on the other hand, has continued to undermine the safe-haven US dollar and, for the time being, has provided some support to the GBP/USD pair. The Fed’s more hawkish outlook, on the other hand, should limit the dollar’s further decline. For example, the US dollar was lower in Asia on Friday morning, and the Japanese yen was on track for its worst week in two years.
The yen’s decline was aided by rising import costs and low-interest rates, while commodity currencies were poised for a second straight weekly gain against the dollar as export prices rose. The US Dollar Index, which measures the value of the US dollar in relation to a basket of other currencies, fell 0.26 percent to 98.540.
The markets may be able to hold on to their gains from the previous few days as the week progresses, but they will be kept busy by conflicting reports from China and Europe, as well as Fed talk.
GBP/USD Price Forecast – Daily Technical Levels
Daily Support and Resistance
S3 1.30843
S2 1.31377
S1 1.31576
Pivot Point 1.31911
R1 1.3211
R2 1.32445
R3 1.32979
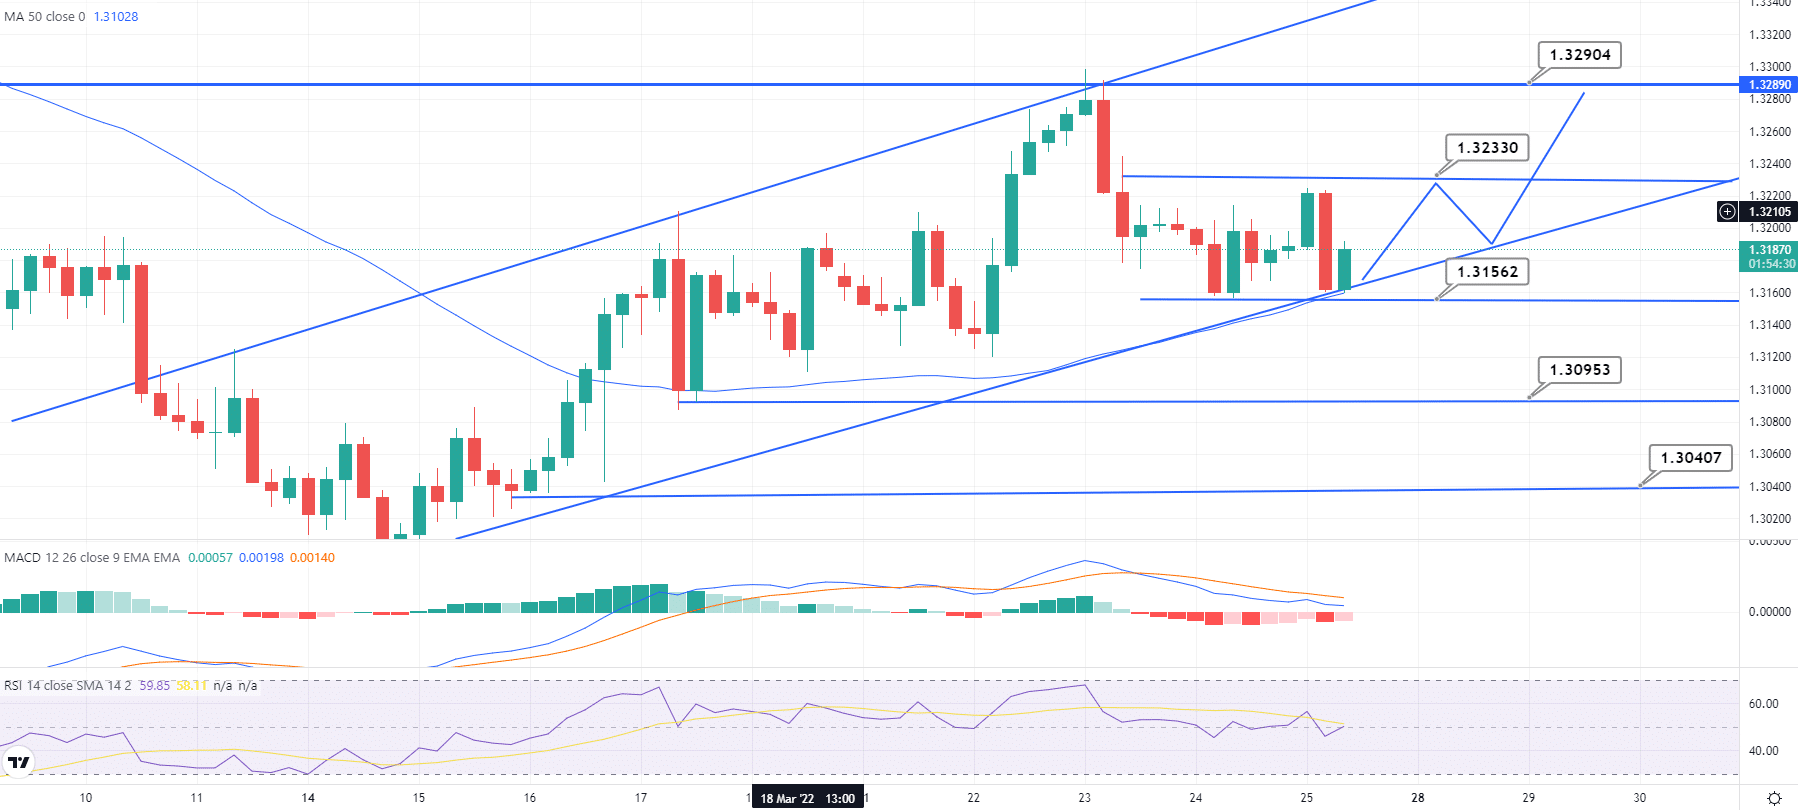
GBP/USD 4-Hour Chart -Upward Trendline in Play
GBP/USD Price Forecast – Technical Outlook
The GBP/USD plunged below 1.3200 after disappointing UK retail sales data. It continued to fall toward 1.3150 in the European session amid a negative shift in risk sentiment. On the four-hour chart, the 50-period and 100-period SMAs appear to have formed strong support at 1.3160.
The Fibonacci 38.2% retracement of the most recent downtrend reinforces this level. If sellers drag the pair below that level, the following bearish targets are at 1.3130 (static level) and 1.3100.
Good luck, and stay tuned for more updates!