GBP/USD Price Sticking to Gains Above 1.35 After UK Jobs Data
Please note that we are not authorised to provide any investment advice. The content on this page is for information purposes only.
- Taking advantage of the reversal in overnight losses, the GBP/USD pair regained momentum on Tuesday.
- A lack of optimism in growth was evident, and UK employment data appeared largely unaffected.
- A safe-haven dollar and geopolitical tensions supported the safe-haven dollar.
The GBP/USD price held onto modest intraday gains in the 1.3535 region on UK employment data.
The GBP/USD pair caught the attention of buyers on Tuesday after showing some resilience below the psychological level of 1.3500, extending overnight losses to weekly lows. Although growth lacked optimism, the mixed UK employment report did not seem adversely affected.
On Tuesday, the UK Office for National Statistics reported a drop of 31.9k individuals claiming unemployment benefits in January, compared to 43.3k in December. Furthermore, the ILO unemployment rate remained steady at 4.1% in the three months to December.
-Are you looking to buy UK shares? Check out for more details-
According to additional data, December’s average earnings continued to fall, although better than forecast. However, this did not significantly impact the British pound and did not assist the GBP/USD pair in capitalizing on its modest gains.
Investor sentiment continued to be affected by fears of a Russian invasion of Ukraine. In addition, the prospect of faster Fed tightening has served as a tailwind for the US dollar as a safe haven and has held back the GBP/USD from further gains, at least for now.
Participants in the market eagerly anticipate the US Producer Price Index (PPI) for January, which is expected later in the North American session. Furthermore, there is a focus on geopolitical developments that could create trading opportunities regarding the GBP/USD pair.
GBP/USD price technical analysis: Bears to break 1.3500
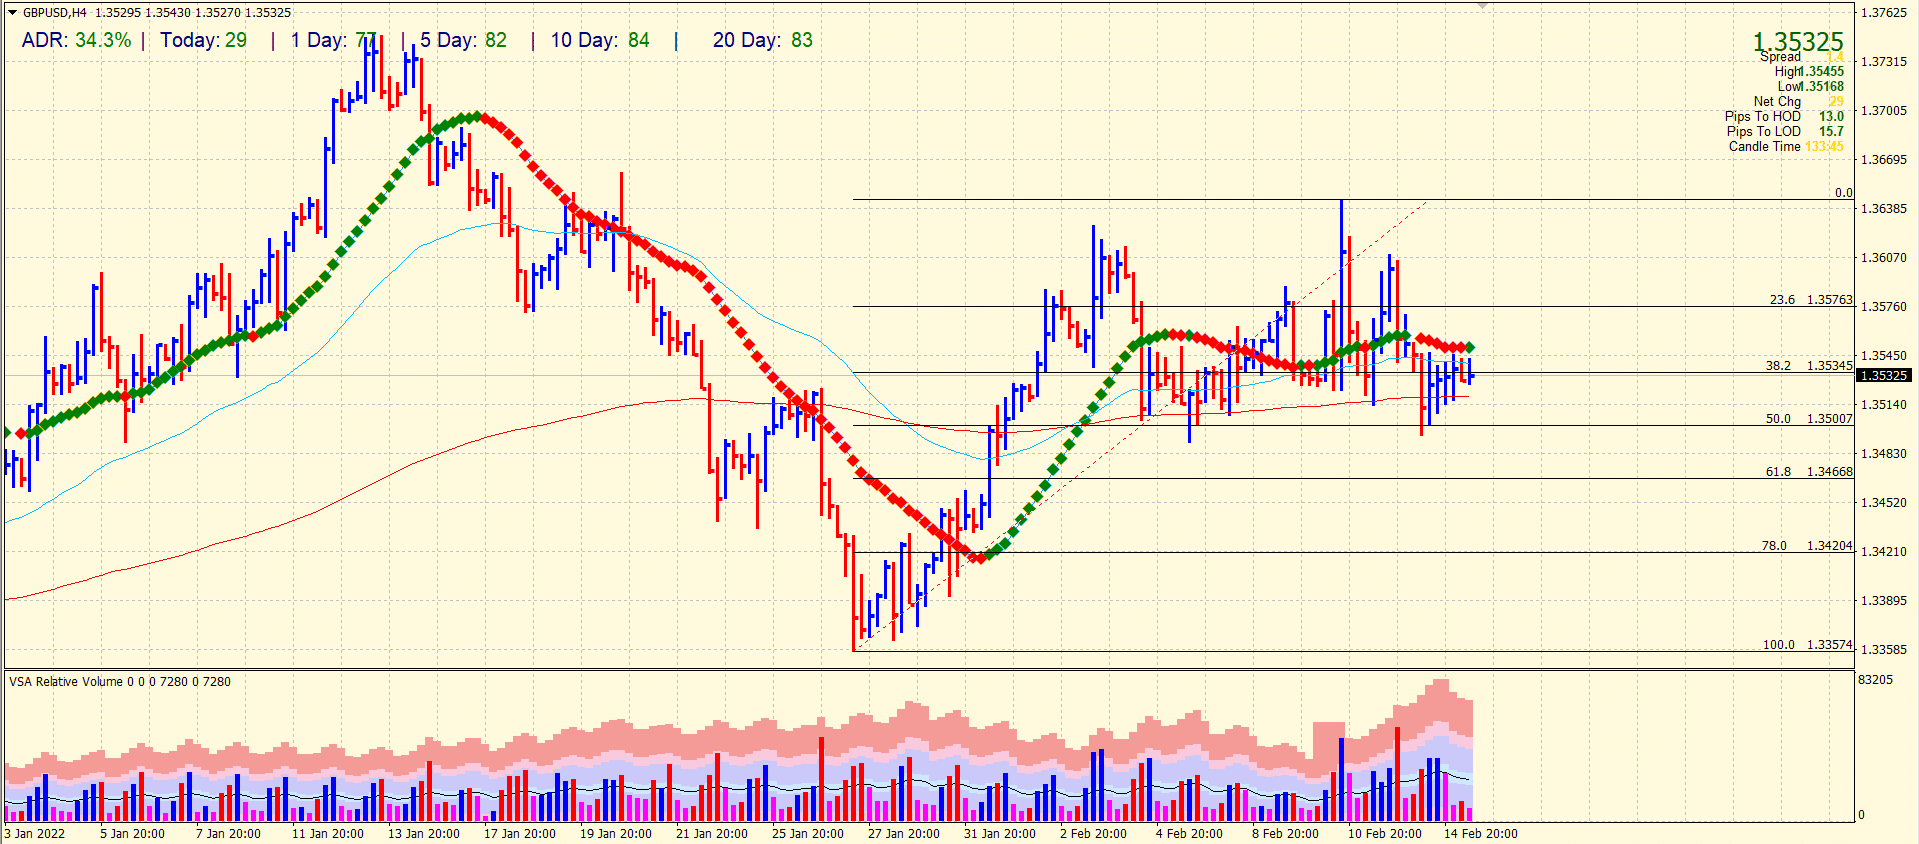
The GBP/USD price has been locked between 50-period and 200-period SMAs on the 4-hour chart. The last six price bars show a very tight-ranging pattern. It indicates a potential for the breakout on either side. However, the probability of a bearish breakout is quite high as the price is constantly wobbling around the lower end of the widespread down bar. Furthermore, the volume for a minor up wave is declining, which supports the bearish potential too. On the other hand, the average daily range is 34% which is normal for the pair.
-Do you need the best trading platform? Check out for more details-
However, the bearish price action may find stiff support around the 1.3500 area as it is a psychological level and 50% Fibonacci retracement level. Therefore, any break below the level may target 1.3460 ahead of 1.3400.