Ripple Price is Up by 1.56% – Time to Buy XRP Coin?

Please note that we are not authorised to provide any investment advice. The content on this page is for information purposes only.
- Ripple has posted consistent gains despite the ongoing legal battle against the SEC.
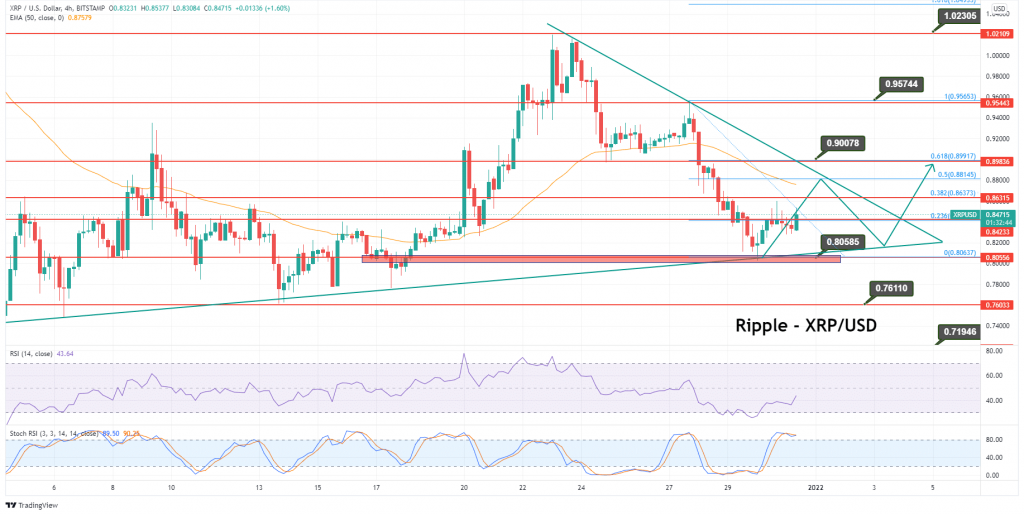
- The XRP price is caught within a symmetrical triangle pattern, implying that Ripple may continue to consolidate.
- Ripple’s barriers could appear at the 21-day SMA at $1.00, followed by the 50-day SMA at $1.04.
Ripple prices are bullish, having surged around 1.56% in the past couple of hours to trade at the $0.8473 level. The day before, the XRP/USD closed at $0.83873 after setting a high of $0.85937 and a low of $0.80312. XRP/USD followed the trend of improving market sentiment and closed the day in the green, with minor gains on the day.
With growing interest in blockchain and crypto as a whole, this might be a good opportunity to buy Ripple and rise with the market.
Ripple’s social dominance negatively impacted
This year, Ripple has posted consistent gains despite the ongoing legal battle against the SEC. The social dominance of Ripple’s token XRP has been negatively impacted due to the legal battle. However, XRP still managed to end the year with significant gains.
Proponents believe that Ripple is closer to winning its legal battle with the SEC and that it could trigger a bull run in XRP prices in the near future. However, proponents recently noted that ripple outflow from top cryptocurrency exchanges has been rising continuously.
As Bitcoin and Ethereum inflows increased, XRP whales began withdrawing their funds from exchanges. A report suggested that two large transfers of ripple from exchange wallets grabbed the market’s attention. A tracker of transactions by whales, WhaleAlert, recorded about 162 million XRP being moved out of Nexo. Market participants believe that this ripple outflow could have triggered the recent decline in XRP.
The latest tweet from Ripple’s CEO, Brad Garlinghouse, stated that despite the ongoing battle with the U.S. Securities and Exchange Commission, 2021 has been the best year for Ripple. He called this year a watershed year for crypto and said that acceptance and awareness were providing an opportunity for billions in the global financial community. He further stated that this year was the strongest year for XRP in terms of growth. These comments also supported the comeback of XRP/USD on Thursday.
Daily Technical Levels
Support Resistance
0.80811 0.86436
0.77749 0.88999
0.75186 0.92061
Pivot Point: 0.83374
Ripple technical outlook – Downtrend continues to dominate
As Ripple struggles to find customers in the market, the price of XRP may fall much more. As a result, the trading volume of the cross-border remittance token has decreased and may continue to fail to find sustainable support. On the 3-day chart, the XRP price is caught within a symmetrical triangle pattern, implying that Ripple may continue to consolidate. The token could fall further to find important support at the lower boundary of the current chart at $0.63, resulting in a 23% drop.
As Ripple struggles to find customers in the market, the price of XRP may fall much more. As a result, the trading volume of the cross-border remittance token has decreased and may continue to fail to find sustainable support. On the 3-day chart, the XRP price is caught within a symmetrical triangle pattern, implying that Ripple may continue to consolidate. The token could fall further to find important support at the lower boundary of the current chart at $0.63, resulting in a 23% drop.
In the spotlight is the 78.6% Fibonacci retracement.
The 78.6 percent Fibonacci retracement level around $0.75, which corresponds to the August 8 low, is the first line of defense for the XRP price. Ripple will gain a foothold at the July 12 high of $0.65. A 71% drop toward $0.18, a bearish target suggested by the symmetrical triangle formation, could be on the way.
If selling pressure develops, ripple might continue to fall near the June 24 low of $0.58, which coincides with the Momentum Reversal Indicator’s support line (MRI). If the bulls are successful in reversing the bearish trend, the XRP price may target the 61.8 percent Fibonacci retracement level at $0.88, followed by the 100 three-day SMA at $0.97, which intersects with the 50 percent retracement level.
Additional barriers could appear at the 21 three-day SMA at $1.00, followed by the 50 three-day SMA at $1.04. If purchasing pressure increases, the XRP price may potentially aim higher toward the 38.2 percent Fibonacci retracement level at $1.06, before Ripple seeks to tag the upper border of the prevailing chart pattern at $1.17, where the 23.6 percent Fibonacci retracement level is also located.
Buy Crypto at eToro from just $10 Now!
![]()