Myanmar – Asia’s Next Tiger?: Dan Steinbock
Please note that we are not authorised to provide any investment advice. The content on this page is for information purposes only.
After almost half a century of isolation, Myanmar could emerge as Asia’s next tiger – but only with the right policies.
After meetings with government representatives, senior executives and think-tank leaders in Myanmar, I spent some time exploring the beautiful nation.
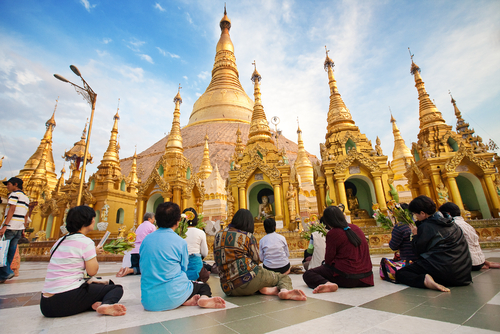
In Yangon, Myanmar’s window to the world, you quickly get an idea of the debilitated infrastructure, the poverty and the 40-degree Celsius heat – and the ingenuity of ordinary people and their dream of a better future.
After almost half a century of isolation, Myanmar could emerge as Asia’s next tiger – but only with the right policies.
After meetings with government representatives, senior executives and think-tank leaders in Myanmar, I spent some time exploring the beautiful nation.
In Yangon, Myanmar’s window to the world, you quickly get an idea of the debilitated infrastructure, the poverty and the 40-degree Celsius heat – and the ingenuity of ordinary people and their dream of a better future.
Since taking office, President U Thein Sein has significantly improved Myanmar’s ties with Washington and European countries, which has unleashed a rapid inflow of Western capital. In the Traders Hotel favoured by foreign execs, the cheapest overnight stay will easily cost more than $300 – even as ordinary people struggle to live on $1-2 per day.
Myanmar is the last frontier of emerging Asia.
Table of Contents
A History Of Pain
Geopolitically, Myanmar is at the crossroads of China in the east, South Asia (India, Bangladesh) in the west, and Southeast Asia (Laos, Thailand, Cambodia) in the South.
The earliest inhabitants of its recorded history were the Pyu who entered the Irrawaddy valley from Yunnan. By the latter half of the 18th century, the Konbaung Dynasty, generated one of the most literate states in Asia – but were no match to British cannons.
The British rule brought several enduring social, economic, cultural and administrative changes that transformed the once-agrarian society. With the “divide and rule” policies, British imperialism took advantage of differences among the myriad ethnic groups, which unleashed long-running civil wars and ethnic animosity – that the West is eager to attribute to Myanmar alone.
After colonial terror, things got a lot worse. As a major battleground during World War II, the country and its infrastructure were devastated by both allied offensives and Japanese terror.
In1947, the legendary Aung San ensured the country’s independence, while negotiating an agreement with ethnic leaders. Months later, he and several cabinet members were assassinated. In 1962, the military led by General Ne Win took control of Burma in a coup d’etat. In the next 12 years, the country was ruled by a revolutionary council and its “Burmese Way to Socialism.” In 1974 came the new constitution of the Socialist Republic, which subjected the Union of Burma to a one-party system, until the late 1980s.
In the 1990 free elections, the National League for Democracy, led by Aug San Suu Kyi, won 80 percent of the seats. Nonetheless, the military leadership continued to rule Myanmar until its dissolution.
Since the 2010 election, the government has embarked on a series of bold reforms to direct the country toward democratization, a mixed economy and reconciliation.
The Cost Of A Lost Half Century
After political reconciliation in April 2012, the international community has suspended most sanctions against Myanmar. Despite bitter ethnic tensions that continue to escalate, the reform momentum remains strong. However, the transition will take time and is not devoid of risks.
Related: US Lifts Restrictions on Myanmar Banks
Related: Myanmar Lifts 50-Year-Old Ban On Privately-Owned Daily Newspapers
Related: World Bank Offers $245 Million In Aid To Myanmar
[quote]Economically, Myanmar has lost half a century of progress and prosperity. In the 1960s, it was a major rice exporter, with average prosperity 10 percent higher than in China, as measured by GDP per capita. By the onset of the global crisis of 2008, the same figure was 55 percent lower than in China. [/quote]
In the past four years, Myanmar’s real GDP has been growing at an estimated 5-6 percent. In the next half a decade, it could sustain a growth rate of close to 6-8 percent. However, the starting-point is very low. Myanmar’s per capita GDP is barely US$1,400, and nearly every fourth of some 60 million people live below the poverty line.
With underdeveloped institutional capabilities, poor revenue performance has led to persistent fiscal deficits, which have been financed by the central bank. As a result, volatile inflation averaged 23 percent between 2001 and 2010, which hit the poor hard, undermining domestic confidence in the kyat.
Myanmar is as large as France, but has a young labour force, abundant natural resources, including natural gas, copper, timber and gemstones. Nonetheless, given high reliance on natural resources and low productivity in agriculture, the economy remains vulnerable to shocks.
The next Asian tiger
Despite the recent influx of Western money and speculators, China remains Myanmar’s largest foreign investor. Naypyidaw, the country’s political capital, is engaged in a delicate balancing act between the old Chinese investment and the new Western capital.
What’s worse, Myanmar is opening in an era of low interest rates and massive liquidity injections in the west, while Japan, its greatest creditor, has initiated a massive gamble of monetary expansion, and growth is slowing in emerging Asia.
Related: Will Reform Inertia Blemish Myanmar’s Economic Potential?
Related: Guarded Optimism At The Gates Of Myanmar
Like China in the early 1980s, Myanmar cannot establish quickly institutional capabilities that would have the confidence of foreign investors. As a result, it is moving toward “special economic zones.”
If such SEZs can be established near major urban centres, such as Yangon and Mandalay, they could accelerate economic growth and attract more foreign multinationals and investors.
[quote]If the current and achievable growth goal of 7.7 percent could be sustained in the coming years, Myanmar would emerge as the next Asian tiger – but not without inclusive growth.[/quote]By Dr. Dan Steinbock
Dr. Dan Steinbock is Research Director of International Business at India China and America Institute (USA) and Visiting Fellow at Shanghai Institutes for International Studies (China) and the EU Center (Singapore).
This commentary first appeared in the South China Morning Post print edition on May 14, 2013 as “Reformed Myanmar could be next Asian tiger to roar”.
Get more special features in your inbox: Subscribe to our newsletter for alerts and daily updates.
Do you have a strong opinion on this article or on the economy? We want to hear from you! Tell us what you think by commenting below, or contribute your own op-ed piece at [email protected]


