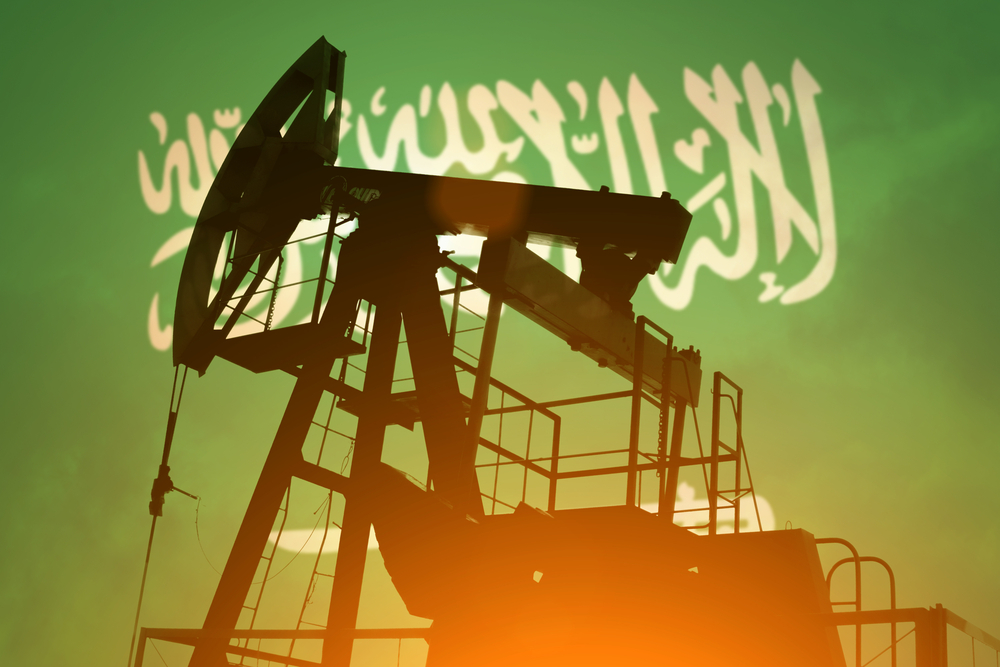
Saudi Arabia Abandoned its Role as the Swing Producer and Consequences are Mounting
Please note that we are not authorised to provide any investment advice. The content on this page is for information purposes only.
In the last quarter of 2014, in the face of possible oversupply, Saudi Arabia abandoned its traditional role as the global oil market’s swing producer and therefore it role as unofficial guarantor of existing ($100+ per barrel) prices.
In the last quarter of 2014, in the face of possible oversupply, Saudi Arabia abandoned its traditional role as the global oil market’s swing producer and therefore it role as unofficial guarantor of existing ($100+ per barrel) prices.
In October, Saudi sources first prepared the market with statements that the country would be comfortable with oil prices as low as $80 per barrel for “a year or two.” At the November OPEC meeting, the Saudi oil minister, Ali Al-Naimi, publicly announced Saudi Arabia would allow market forces to set prices. He argued that rapidly growing production outside OPEC made the existing status quo unviable, and that lower prices in the short term would increase prices in the longer term through reduced investment and ultimately benefit all OPEC members.
Parallel with this shift, Saudi officials expressed confidence in their country’s financial wherewithal to withstand the repercussions of lower oil prices.
The Saudis Expected a Hole, Not a Bottomless Pit
The Saudis obviously miscalculated the degree to which their shift would negatively impact oil prices. The average price of Brent, the global benchmark, fell below the Saudis’ $80 floor in November, fell to $62.34 in December, and then fell below $50 in February. Prices rebounded to $60 for a few months, before falling once again below $50.
Plunging oil prices have substantially reduced Saudi revenues. With Brent prices averaging roughly $100 per barrel in 2014, Saudi oil exports of 6.31 million barrels per day would have generated roughly $631 million in revenues daily. In the first quarter, with Brent prices averaging $53.92, the same output would have generated roughly $340 million daily, $291 million less per day than oil at $100 per barrel.
The Saudis have attempted to mitigate the revenue shortfall through increased production, ramping up output from 9.6 million barrels per day in the fourth quarter of 2014 to an eye-popping 10.5 million barrels per day in June.
The revenue from increased production, however, is overwhelmed by the collapse of prices, which has ripped a substantial hole in the Saudi budget. In December 2014, the Saudi government approved spending $229 billion in 2015, resulting in an estimated deficit of $39 billion, or some 5 percent of GDP.
As mid-year 2015 approached, the IMF estimated the budget deficit would equal approximately 20 percent of Saudi GDP. The Financial Times quoted analysts as estimating the Saudi budget deficit in 2015 at $130 billion. Even with massive deficit spending, the IMF estimated GDP growth would slow from 3.6 percent in 2014 to 3.3 percent in 2015, and then just 2.7 percent in 2016.
Racing to Barrel Oil
The Saudi miscalculation has several sources. One is the negative feedback loop between oil production, GDP, and national budgets that plagues many non-Western oil producers. Their GDP and national budgets depend significantly on the revenues from their oil exports. As a result, the revenue shortfalls incentivize them to produce as much oil as possible to mitigate the shortfall.
According to the IEA, daily output in June 2015 increased 3.1 million barrels over 2014, with 60 percent (1.8 million barrels) coming from OPEC. At 31.7 million barrels per day, OPEC output reached a three-year high.
This increase in output occurs with the context of a narrow global demand opportunity. Growth in demand in 2015, which the IEA forecasts to average around 1.4 million barrels per day, comes primarily from Asia and North America. In other major export markets, demand is stagnant. That has oil-exporting countries, including OPEC members, Russia and others, focusing their sales on Asia, particularly China. North American demand is growing now that oil prices are low, but due to high levels of domestic production, the U.S. is no longer a growth market for oil exporters.
Each producer, therefore, is incentivized to undercut other producers directly (price per barrel) or indirectly (absorbing shipping cost or delivery risk) to win sales in Asia (or displace incumbent suppliers in other major markets). National oil producers can and are shifting the cost of the lowered prices to other sectors of the economy. The U.A.E., for example, has ended fuel subsidies, thereby essentially, increasing its budget revenues, while Saudi Arabia recently floated a $4 billion domestic bond offering to help finance its budget.
Asian customers are taking advantage of the competition. They are reducing the share of long-term contracts in favor of spot purchases. For example, as the Wall Street Journal reported, some Japanese refiners are cutting the proportion of oil purchased through long-term contracts to around 70 percent from more than 90 percent, while some South Korean refiners are reducing the proportion from 75 to 50 percent. Furthermore, several national oil companies, Venezuela’s among them, are building refineries with local partners in Asia, which will use their crude.
Given this environment, it is not surprising that the revenue elasticity of production is highly sensitive, and negative. Saudi Arabia increased production by 6.8 percent in the first quarter of 2015 but saw export revenues shrink by 42 percent.
Any Saudi Victory Will Be Pyrrhic
Saudi confidence in their financial wherewithal is proving misplaced. Their need for revenue is intensifying rather than moderating. They are fighting a multi-front war with Iran directly (in Yemen) and indirectly (in Syria, Lebanon, and Iraq). ISIS, Al Qaeda, and disaffected Shias present a significant domestic security threat. Countering external and internal threats demands increased spending (including, perhaps, a very expensive future nuclear weapons program), as does placating the fast growing male and female youth demographic, which requires substantial spending on education, training, employment, and support. Hence, the budget deficit equal to 20 percent of GDP, noted above.
Increased production does not offer a solution. Saudi Arabia does not have the capacity to increase production sufficiently to reduce the shortfall significantly in any meaningful timeframe. They currently do not have the spare capacity—to make up for the $291 million in export revenue lost in Q1, 5.4 million more barrels a day would have been necessary at $53.92 a barrel. Of course, such a drastic increase in output would have driven prices even lower.
It is doubtful they can increase capacity substantially even in the medium- to long term. They will not be able to spend significantly more than other major national oil companies. First, low prices reduce Aramco’s cash flow and therefore its ability to fund investment. Second, the Saudi government likely will increase its draw from this cash flow to fund higher priority national security and domestic security needs.
Third, Saudi refusal to act as price guarantor undercuts the confidence foreigners need to invest in, or loan to, oil projects. What might be attractive at $75 per barrel oil is not at $50 oil, and even less attractive if the price of oil is thoroughly unpredictable. Fourth, in terms of political risk, Saudi Arabia with its Gulf allies, Iran, and Iraq, and the Middle East in general, are at the epicenter of global tension, turmoil, and tumult. Fifth, its influence within OPEC, and therefore its ability to manage OPEC output and prices, is diminished. Their underestimate of the impact of their policy change on prices, their indifference vis-à-vis the financial damage to other OPEC members, and their willingness to take market share at the expense of other OPEC members undercut their credibility within OPEC (particularly since it derived from Saudi willingness to protect the interests of all members (and sometimes to endure disproportionately).
While Saudi financial reserves are substantial (circa $672 billion in May), drawing on them is little more than a stopgap measure. If its major competitors (Russia, Iraq, Iran, and North America) maintain or even increase output (and they have the incentive to do so), prices could stay lower far longer than the Saudis anticipated. Saudi reserves have decreased some $65 billion since prices started to fall (in November), so ~$100 billion to ~$130 billion at an annual rate. The longer prices stay low, the faster their reserves fall, and, as reserves plummet, the greater the pressure to prioritize spending, to the disadvantage of some Saudis.
Saudi Arabia Caused The Problem, Can It Engineer A Solution?
Saudi officials apparently viewed $90 or even $80 per barrel oil for “one or two years” with equanimity. Can they maintain the composure they have displayed thus far as they incur in a single year the revenue losses they expected to take four years (at $90 oil) or two years (at $80 oil)?
In addition, if they can’t—and surely, though they are loath to admit it, they can’t—can they engineer a durable increase in prices—i.e., a durable decrease in output? At first glance, it seems impossible. Daily output from Saudi Arabia (10.5 million), and its allies, UAE (2.87), Kuwait (2.8), and Qatar (.67), is roughly equal to the daily output from countries with which it is in conflict, directly or indirectly, Russia (11.2), Iran (2.88), and Iraq (3.75), and therefore have an incentive to take advantage of any unilateral Saudi output concessions.
Yet, in effect, these countries are engaged in the oil equivalent of mutually assured destruction. The sharp drop in oil revenue damages each of these countries economically and financially, while the wars they wage directly and indirectly against each other drain resources from vital domestic projects.
Moreover, given the sensitivity of prices to changes in volume, it is possible, if not likely, that holding output steady or matching a Saudi decrease barrel for barrel could generate an absolute increase in revenues for all.
Saudi Oil Strategy: Brilliant or Suicide? is republished with permission from Oilprice.com


