
Dot-Plots 101: A Guide to Fed Opinions
Largely the Summary of Economic Projections, the infamous dot-plot, drove the dramatic reaction to last week’s FOMC meeting, which may still not be complete. This Great Graphic shows the latest iteration.
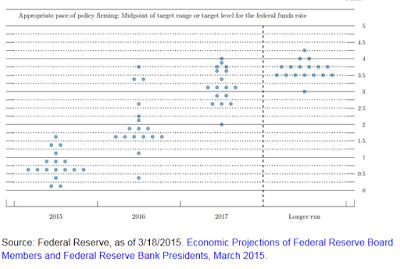
What riveted the investors was the sharp reduction in the dots compared with December 2014 iteration. This was the essence of the market’s dovish read.


