
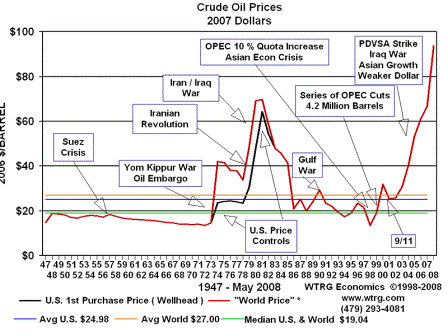
Historical Oil Price Charts and Graphs
A review of historical oil prices shows that oil displays wide price swings when markets suffer from scarcity or oversupply. The price cycle of crude oil ranges from a small duration to several years.
Major Events: Historical Oil Prices
From 1948 to 1970, oil prices remained stable at around $3 per barrel. A major development was the formation of OPEC in 1960; consisting of Iraq, Iran, Saudi Arabia, Kuwait and Venezuela.