Panama Canal: It’s OK if You Have a Bigger Boat
Please note that we are not authorised to provide any investment advice. The content on this page is for information purposes only.
World shipping changed forever when the Panama Canal opened on August 15, 1914. It was an engineering marvel of its day, cutting the distance required to get from the Pacific Ocean to the Atlantic by as much as 8,000 nautical miles.
World shipping changed forever when the Panama Canal opened on August 15, 1914. It was an engineering marvel of its day, cutting the distance required to get from the Pacific Ocean to the Atlantic by as much as 8,000 nautical miles.
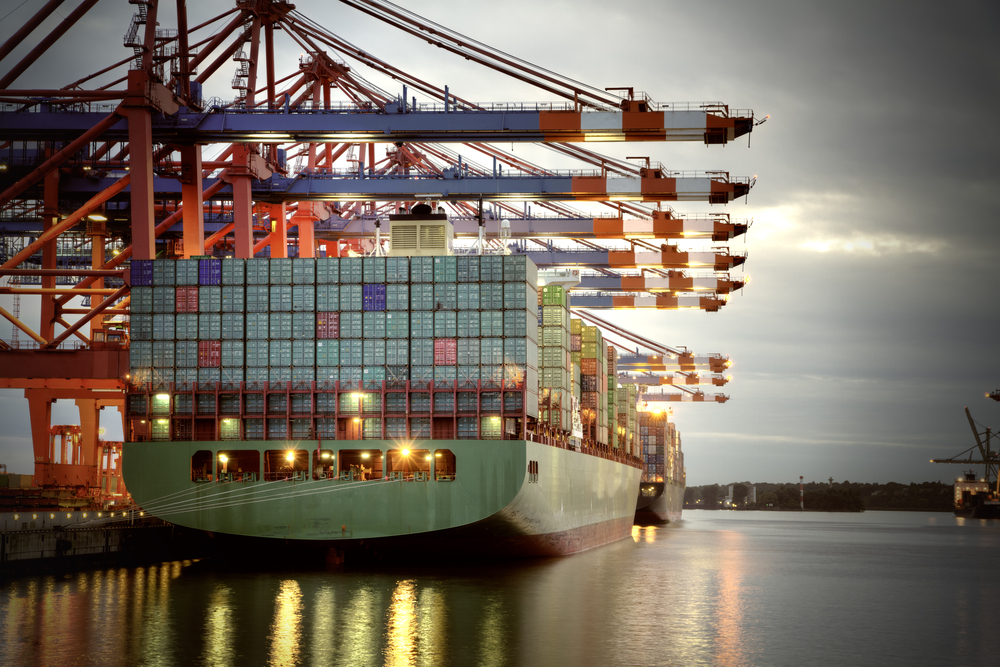
The shipping industry is changing once again as 70 heads of state gathered in Panama City recently to celebrate the canal’s expansion to handle the super-sized ships that now dominate global trade. They were there to witness a Chinese container ship become the first commercial vessel to take advantage of the new, larger locks to pass from the Atlantic Ocean to the Pacific.
As a civil engineer and native of the Panama Canal Zone, I have long marveled at the feats of the original and am impressed by its expansion. So what prompted the Panama government to finally expand it after more than a century? What makes it innovative and what challenges remain?
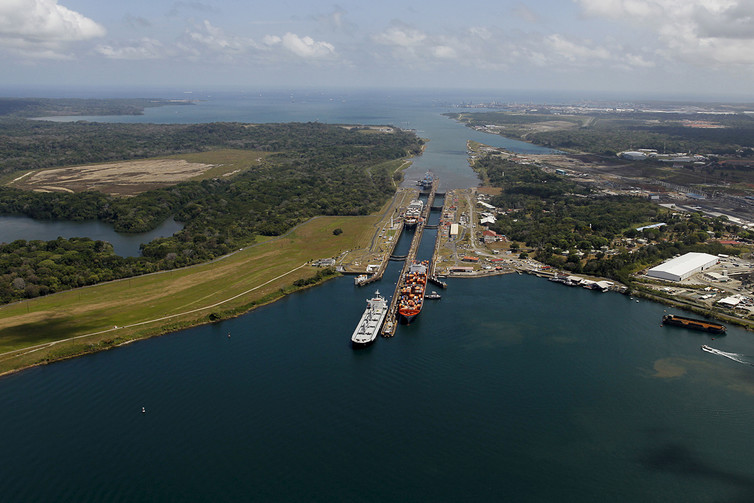
The canal had to be expanded to allow for today’s super-sized cargo ships. Carlos Jasso/Reuters
Wonder of the modern world
The U.S. government built the original, 50-mile Panama Canal after a failed effort by the French in the late 19th century.
The American Society of Civil Engineers named it one of the seven wonders of the modern world in 1994.
When the canal first opened, it was the size of U.S. Navy ships that dictated the width of the locks: 110 feet across and 42 feet deep. Before it opened, ships had to journey all the way down to the Strait of Magellan near the tip of South America to cross from New York to San Francisco.
Ships enter the canal through a series of three chambers, which lift the vessels up to the higher level of Gatun Lake through which they will glide, and subsequently lower them to sea level. In addition, tides on the Atlantic side are much lower than the Pacific.
The upgrade, which cost $5.25 billion and was built alongside the old locks, was designed to support the contemporary needs of global commerce from Asia. Modern so-called neo-Panamax ships can be more than 150 feet wide, extend three football fields in length and have a draft of 50 feet. (Draft is how deep into the water a ship goes below the surface.)
New locks’ innovative engineering
When designing the new locks, engineers knew they needed constant access to plenty of water to flood the locks and ensure the ships don’t hit bottom.
Having enough water has been a problem with the current locks, such as during a recent drought when shippers had to lighten their loads to make it through. So with the new ones, they created water-saving basins, which capture and recycle water as ships step down from chamber to chamber. Consequently, even though the new locks are 3.3 times larger than the 1914 ones, they use 7 percent less water.
Another enhancement is the expansion locks’ use of rolling gates to close each lock, a significant upgrade from the old ones. The rolling gates allow maintenance to be performed without having to temporarily close the lock, saving lots of time and money.
In addition, whereas the 1914 locks used electric towing locomotives (known as mules) to guide ships through the locks, the expansion locks will rely on two positioning tugboats (fore and aft) to position vessels during transit, which is more efficient – though there are some concerns, as noted below.
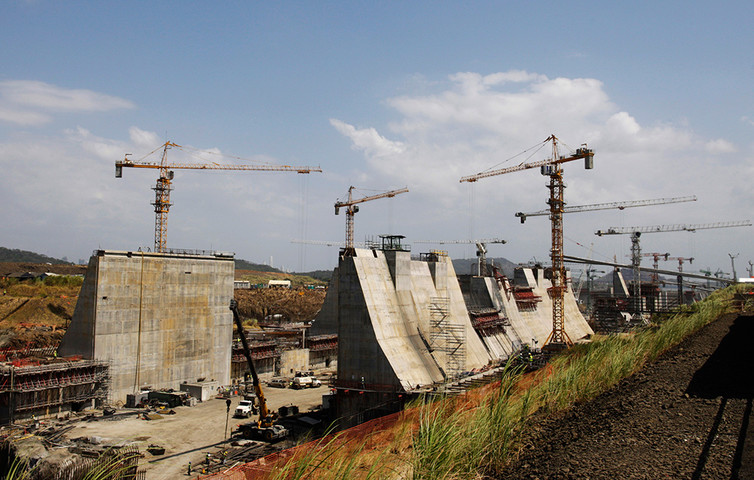
The new locks are 3.3 times larger yet use 7 percent less water. Carlos Jasso/Reuters
East Coast ports prepare
The impending arrival of new Panamax ships with a required draft of 50 feet has sent East Coast ports and businesses in the U.S. scrambling to benefit from this increased cargo.
Currently, only Baltimore, Norfolk and Miami are ready to accommodate these larger ships and containers. Shipping channel deepening and widening dredging projects are underway in Savannah (which currently allows draft of up to 47 feet) and Charleston.
In addition, in New York, the Bayonne Bridge, which spans the channel between Bayonne, New Jersey and Staten Island, currently restricts both states’ biggest ports from accepting these super-sized vessels. The project to raise the bridge has been delayed until the end of 2017 because of engineering miscalculations and construction work slowed by inclement weather.
Expansion project challenges
Besides which U.S. ports are ready for the canal, the project has encountered other difficulties, as is typical with many projects of this magnitude.
Most notable of these been the cost and time overruns (two years longer than expected), leaks within the concrete lock walls and concerns about the use of tugboats instead of electric towing locomotives. The main worry on the tugboats is that they won’t have sufficient control of the vessel, particularly during the dry season when trade winds blow hard.
Mixed in with these challenges is the drop in demand for global trade and one of the worst shipping industry slumps ever thanks in part to the slowdown in China, which has diminished the expansion’s economic viability.
However, history reminds us that the construction of the original canal was also fraught with obstacles. The French company that started the project in the 1880s went bankrupt and severe landslides necessitated an additional excavation of 25 percent more soil than originally planned.
However, these challenges were overcome, and the U.S. completed the canal in 1914, although just one year later, it was closed for seven months after another landslide.
So certainly, there will be more “hiccups,” as there always are, but I expect they will also be surmounted, and we will be able to celebrate Panama’s marvelous engineering achievement.
Explainer: how Panama Canal expansion will transform shipping once again is republished with permission from The Conversation


